
Inflation Summary:
- Annual Inflation fell from 1.37% in September to 1.18% in October.
- CPI Index rose slightly from 260.280 in September to 260.388 in October.
- Monthly Inflation for September was 0.14% and only 0.04% in October.
- FED Funds Rates decrease slightly while FED Assets inch up.
- Next release December 10th
Annual Inflation Chart:
Looking at the Annual Inflation Chart since 1989 we can see a marked downward trend.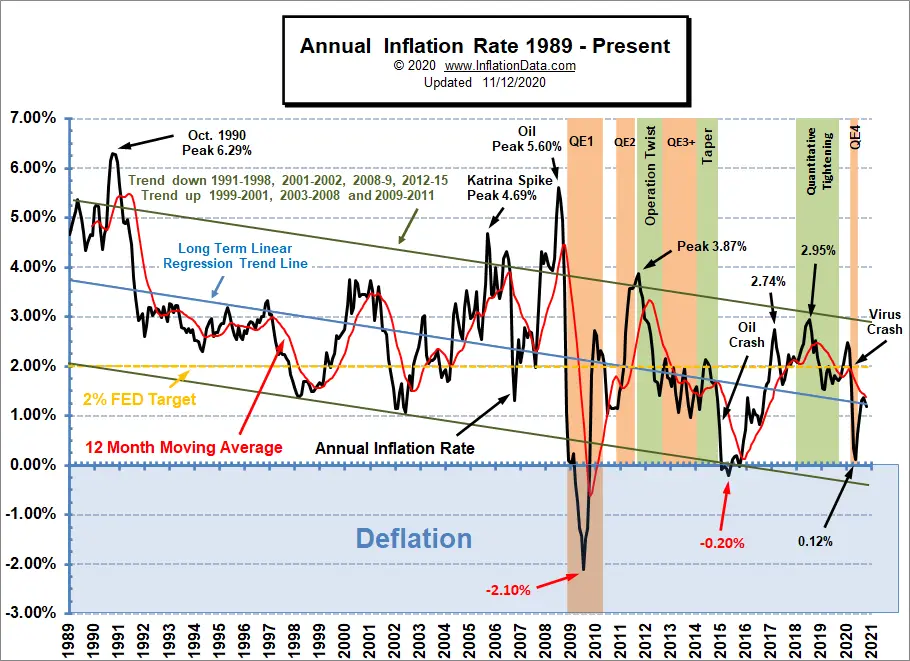
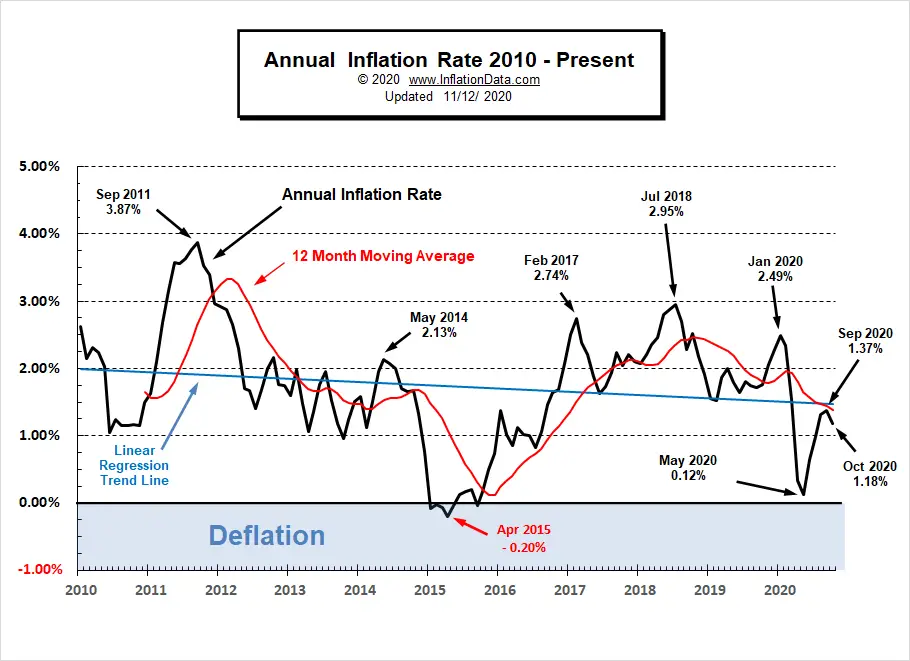
Current Inflation Situation
Looking at just the most recent 10 years the trend is less obvious. Inflation bottomed at 0.12% in May before climbing to 1.37% in September and falling to 1.18% in October. But the Linear Regression Line is still tilted slightly downward.
BLS Commissioner’s Inflation Report:
Sometimes the BLS report doesn’t make a whole lot of sense. According to the BLS commissioner’s report, “The Consumer Price Index for All Urban Consumers (CPI-U) was unchanged in October on a seasonally adjusted basis after rising 0.2 percent in September, the U.S. Bureau of Labor Statistics reported today. Over the last 12 months, the all items index increased 1.2 percent before seasonal adjustment… The all items index rose 1.2 percent for the 12 months ending October, a slightly smaller increase than the 1.4-percent rise for the 12-month period ending September. The index for all items less food and energy rose 1.6 percent over the last 12 months after rising 1.7 percent in September. The food index increased 3.9 percent over the last 12 months, while the energy index declined 9.2 percent.”
So what the BLS is saying is that on a Seasonally Adjusted basis the monthly inflation rate was 0.2% in September (see September column below) and Seasonally Adjusted October monthly inflation is zero. On an unadjusted basis, annual inflation is 1.2%.
When we measure it to two decimals (on a non-adjusted basis) monthly inflation was 0.14% in September and 0.04% in October. While annual inflation was 1.37% in September and 1.18% in October.
Seasonally Adjusted Inflation Components Table
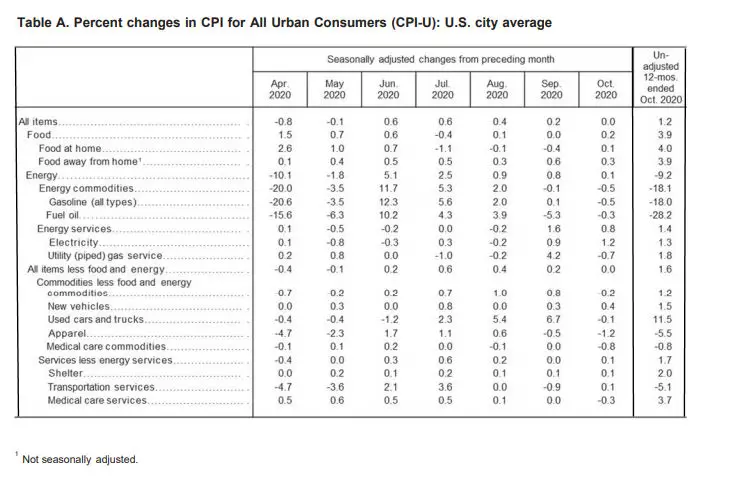
From the table above we can see that several components in the Energy category were down roughly a half percent in October and were down significantly on an annual basis. For instance, Gasoline was down -18.0% and Fuel Oil was down -28.2%. Used cars, on the other hand, were up 11.5%. Apparel and Transportation services were both down over 5%.
Not Seasonally Adjusted Monthly Inflation Rates
Monthly inflation for June was 0.55% comprising the majority of the annual inflation since March and April’s deflation canceled out much of the rest of the year’s inflation.
| Jan | Feb | Mar | Apr | May | Jun | Jul | Aug | Sep | Oct | Nov | Dec | |
| 2016 | 0.17% | 0.08% | 0.43% | 0.47% | 0.41% | 0.33% | (0.16%) | 0.09% | 0.24% | 0.12% | (0.16%) | 0.03% |
| 2017 | 0.58% | 0.31% | 0.08% | 0.30% | 0.09% | 0.09% | (0.07%) | 0.30% | 0.53% | (0.06%) | 0.002% | (0.06%) |
| 2018 | 0.54% | 0.45% | 0.23% | 0.40% | 0.42% | 0.16% | 0.01% | 0.06% | 0.12% | 0.18% | (0.33%) | (0.32%) |
| 2019 | 0.19% | 0.42% | 0.56% | 0.53% | 0.21% | 0.02% | 0.17% | (0.01%) | 0.08% | 0.23% | (0.05%) | (0.09%) |
| 2020 | 0.39% | 0.27% | (0.22%) | (0.67%) | 0.002% | 0.55% | 0.51% | 0.32% | 0.14% | 0.04% |
See: Monthly Inflation Rate for more information and a complete table of Unadjusted Monthly Rates.
For more information See Annual Inflation.
Federal Reserve Actions
According to the National Bureau of Economic Research (NBER) the U.S. has been in a recession since February (shaded area) after the longest boom in economic history. According to NBER the peak occurred in February 2020. Often their peaks will take a long time before people realize that things are not going well. It is, however, possible that the “recession” will be short-lived if the economy can get back on track especially in light of all the FED money pumping going on.
In the following chart, we see the Federal Reserve Total Assets have gradually increased over the last few months. This has made up for the decrease in assets (QT) from June 10th through July 8th 2020. When the FED shrunk assets at that time, several market commentators panicked assuming the market would crash as well.
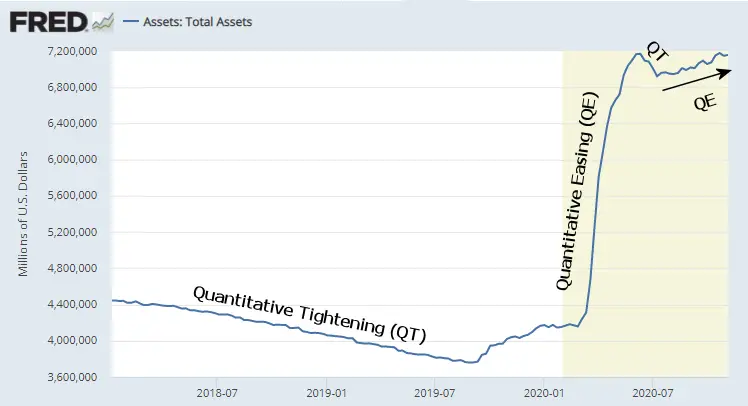
At first glance, that decrease is worrying for the stock market. But if we look at the breakdown of the FED assets in the chart below we see that the entire decrease comes from “Liquidity Facilities” and not “Securities”. Liquidity facilities typically are near zero so they are simply returning to normal. For more information see Is the FED tightening?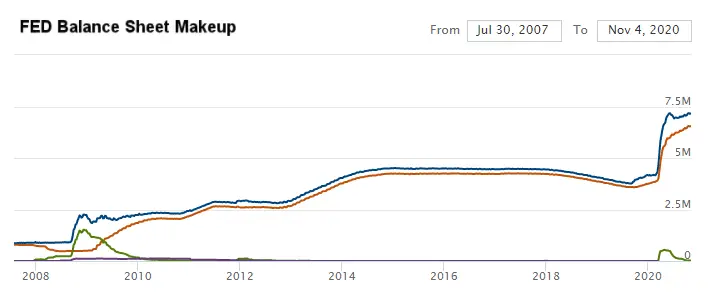
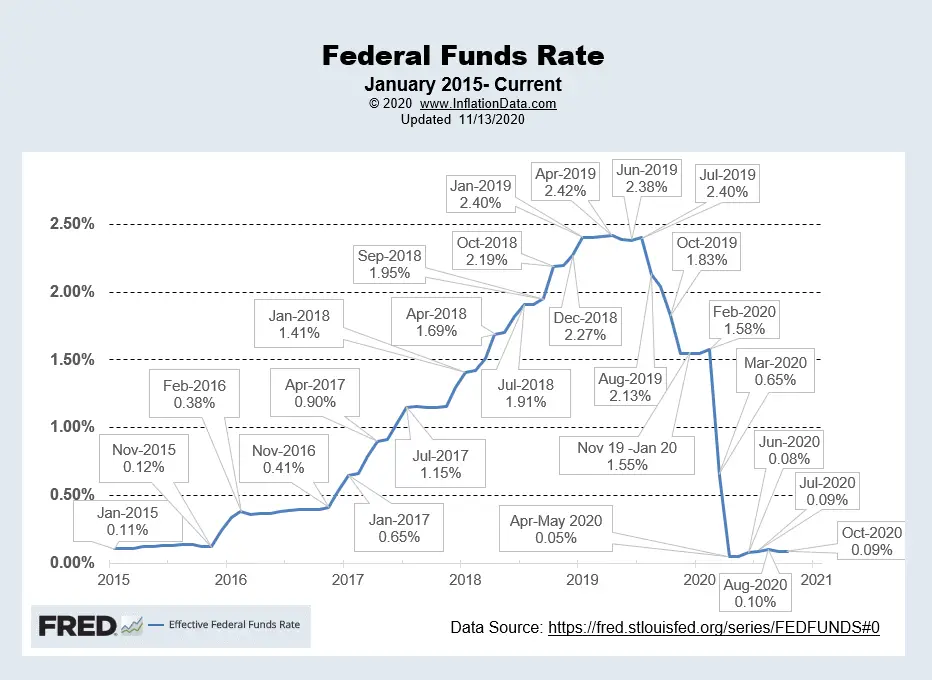
FED Funds Rate
In the chart below, we can see that the FED Funds Rate peaked at 2.42% in April 2019 at that point the FED began fearing that it was holding too tight and the stock market was suffering so it began easing. It leveled off in November at 1.55% where it stayed until February. At that point, COVID tanked the market, and the FED loosened rates to virtually zero (actually 0.05%) five one-hundredths of a percent. In June they moved it up to eight one-hundredths of a percent and then in July, it inched up another one-hundredth of a percent. Then in August, it moved up another one-hundredth of a percent. These increases are essentially symbolic it is still virtually zero. But even that was too much so in September and October the FED dropped it back to 0.09%.
For more info See NYSE ROC and MIP.
Misery Index
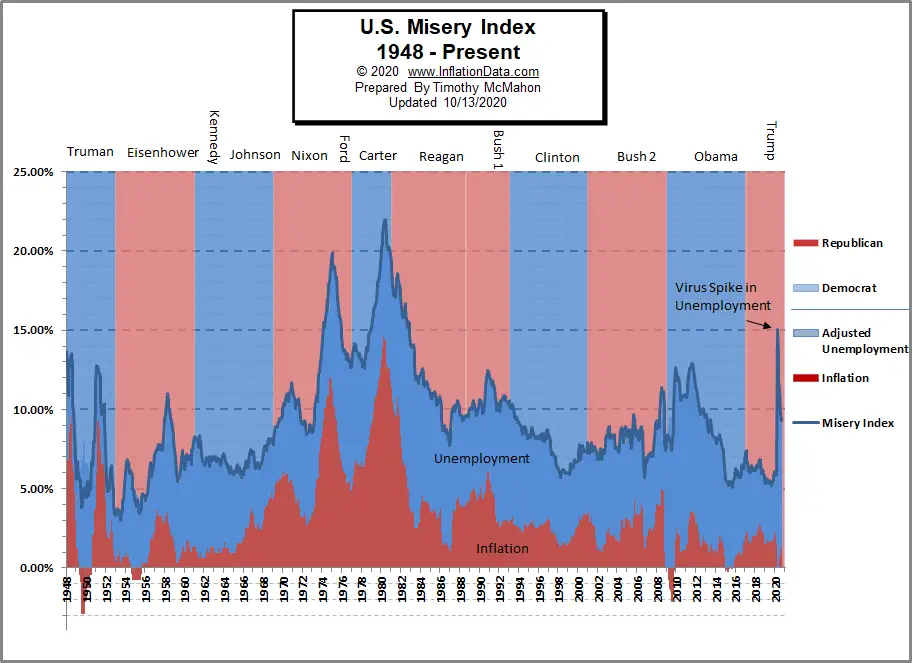 In September 2019, the Misery index was near all-time lows at 5.21%.
By March 2020, it had climbed slightly to 5.94%. But in April, due to the COVID-19 shutdown and consequent high unemployment, the Misery Index shot up to 15.03% based on 14.7% unemployment and 0.33% inflation. In May both inflation 0.12% and Unemployment 13.30% fell, resulting in a Misery index of 13.42%. By July unemployment had fallen to 10.2% and inflation had risen slightly to 0.99% resulting in a Misery index of 11.19%. In September, unemployment fell to 7.9% and inflation was virtually unchanged at 1.37%. In October both Unemployment and Inflation decreased. Unemployment fell to 6.9% and inflation was 1.18% resulting in a misery index of 8.08% down from 9.27% in September.
[Read More…]
NYSE Rate of Change (ROC)©
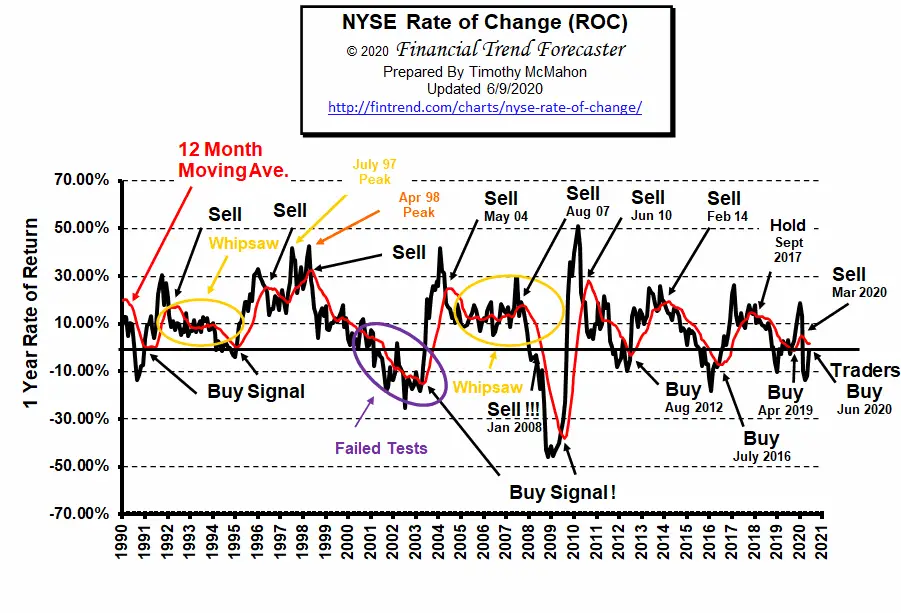
Buy Signal (Whipsaw)
Not surprisingly with all that has happened, 2020 has been a giant rollercoaster ride (aka. whipsaw) for the NYSE.
See the NYSE ROC for more info.
NASDAQ Rate of Change (ROC)©
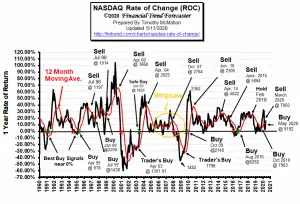
Hold Signal!
The ROC index is ABOVE its moving average. But as we said in the NYSE ROC these are uncertain times and combined with the lofty heights of the NASDAQ caution is warranted. Thus the HOLD Signal.
See NASDAQ ROC for more.
Moore Inflation Predictor (MIP)
This month the MIP is predicting a slightly down month. And is actually projecting relatively little in the way of change through March.
See: Moore Inflation Predictor for more info
Regional Inflation Information
The U.S. Bureau of Labor Statistics also produces regional data. So if you are interested in more localized inflation information you can find it here.
| AL | AK | AR | AZ | CA | CT | CO | DC | DE | FL | GA | GU | HI | IA |
| ID | IL | IN | KS | KY | LA | MA | MD | ME | MI | MN | MO | MS | MT |
| NC | ND | NE | NH | NJ | NM | NV | NY | OH | OK | OR | PA | PR | RI |
| SC | SC | SD | TX | UT | VA | VI | VT | WI | WA | WI | WV |
You Might Also Like:
From InflationData.com
- Emerging Technologies
- A Better Understanding of How IRS Audits Work
- September Inflation Virtually Unchanged
- The Price of Oil Denominated in Bitcoin
- How has Venezuela’s Bitcoin experiment Fared?
Read more on UnemploymentData.com.
- Healthcare Careers on the Rise
- October Employment Up 1.6 Million
- Should You Buy a House When Unemployed?
- 3 Top Tips for Climbing the HR Career Ladder
- Understanding Students Helps University Marketing
From Financial Trend Forecaster
- China Ramps Up U.S. Crude Oil Imports
- Speed and Affordability: Cost of Internet Access Over Time
- New Technologies in the Oil and Gas Industry
- Oil Majors That Bet Big On Renewables
From Elliott Wave University
- Does the Stock Market Really “See” the Future?
- Gold: See What This Fibonacci Ratio Says About the Trend
- Forecasting Markets by Looking at Chart Patterns
- Seeking Certainty in Uncertain Times?
- Emerging Markets and Epidemics
From OptioMoney.com
- Should You Buy a Second Home?
- Learning to Trade from Video Tutorials
- How Saxo Bank Democratizes Trading and InvestmentFive Business Tips to Help Your Company Thrive
- Have Minimal Car Insurance? What to Do in Case of an Accident
- How to Choose a Residential Roofing Contractor
From Your Family Finances
- 4 Frugal Money Saving Tips to Cut Expenses
- Simple Maintenance Tips to Keep Your Family Car in Working Order for Years
- Evaluate Your Finances to Know You’re Ready to Buy a House
- How to Calculate the Costs of Relocation
Pursuing a Wrongful Death Claim After the Death of a Loved One

Hi Tim,
You’re brilliant. Thank you for sharing your wealth of information so willingly! I just sold my house two months ago in Duxbury MA because we need extra space due to our growing family but I’m nervous about the next step. We would like to remain in Duxbury but inventory is dead low. I’m wondering you have any other articles that could support our decision to purchase a new home when there is added inventory. Judging by your graphs, it looks like the potential is there to be paying a mortgage with deflated dollars in the coming years… is it just a terrible time to purchase unless we see some sort of buyers market within the next few months?
-Gabe Raciti