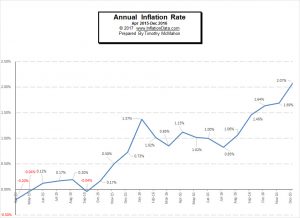
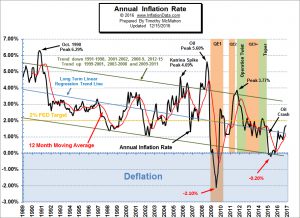
Annual inflation for the 12 months ending in May 2017 was 1.87%. Inflation has steadily moved lower month by month from its peak of 2.74% in February. First falling to 2.38% in March, then down to 2.20% in April, and finally 1.87% in May. Although Inflation has fallen it is still slightly above its 12 month moving average (Red Line) indicating that the short-term trend is still up, although the gap is closing, a cross below the moving average would indicate that the short term trend has switched to "down". Since 2008, there has been a battle between inflation and deflation with the FED fighting against deflation. In March, the FED has switched sides and is raising interest rates. … [Read more...]
Effects of Inflation on Businesses
When we think of inflation we usually think of how it affects us as consumers. But the effects of inflation are wide ranging, including not only individuals but also businesses and even countries. Consumers and businesses alike have to deal with the impact of inflation, both good and bad. Here are some ways in which inflation affects businesses: 1. Consumer Purchasing This is the most obvious impact to businesses. Rapidly rising prices will cause consumers to (as Samuel Goldwyn famously said) "stay away in droves". There are ways for businesses to plan for inflation to reduce the chances of revenue loss. Gradually increasing prices will prevent a sudden price hike, and if your … [Read more...]
Inflation Rate Falls for April
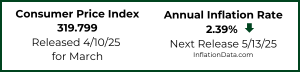
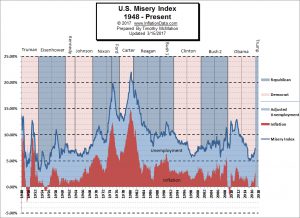
The U.S. Bureau of Labor Statistics (BLS) released the monthly and annual Inflation numbers for April 2017. Annual inflation was 2.20% down from 2.38% in March, 2.74% in February, and 2.50% in January but above the 2.07% in December. Consumer Price Index (CPI-U) 244.524 up from 243.801 in March Monthly Inflation for April was 0.30% very close to February's 0.31% and similar to the average between March's 0.08% and January's 0.58%. Next release June 14th With Inflation falling almost 2/10ths of a percent and unemployment down one-tenth of a percent the Misery Index is down 3/10ths of a percent. The misery index helps … [Read more...]
Should Investors Diversify Using Inflation-Protected Annuities?
The drop in the unemployment rate, moderate salary growth, and the increase in the federal funds rate have become the key markers of the economy’s continued recovery. While these are positive indicators, a strengthening economy can also trigger a rise in prices, resulting in higher inflation. Since July 2016, CNBC states inflation in the United States has climbed steadily after hitting 0.8%. As energy prices rebound after a massive drop for much of 2016, the inflation rate is likely to remain close to its current levels in the coming months. Rising inflation can prove problematic for investors as investment returns are unable to keep pace with rising prices. More so for retirees, who … [Read more...]
March Inflation: Can 2 Wrongs Make a Right?
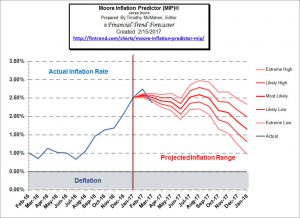
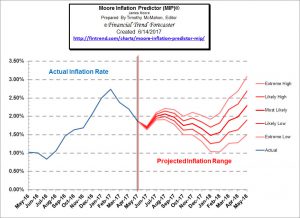
Back in February (based on January data) our Moore Inflation Predictor (MIP) forecast that March's inflation rate would be between 2.41% and 2.63% and today the Bureau of Labor Statistics said that March's annual inflation rate was 2.38%. So we were pretty close but how we got here is another matter entirely. In this case, two wrongs actually did make a right. As you can see from the chart below (we added a reality line to show what actually happened) first the inflation rate shot way above our projection and then it shot slightly below like some sort of drunk driver over-compensating while trying desperately to stay on the road. You can see what our MIP is projecting now … [Read more...]
Inflation Reaches Highest Level in 5 Years
On Wednesday March 15th the U.S. Bureau of Labor Statistics (BLS) released their monthly Inflation report for the 12 months ending February 28th . The Consumer Price Index (CPI-U) came in at 243.603 up from 242.839 in January. This resulted in a 0.31% monthly inflation and 2.74% annual inflation. The last time the annual inflation rate was this high was in February of 2012 when it was 2.87%. After a deflationary period from March through October 2009, massive quantitative easing, caused a 2 month flirtation with inflation nearing 3% but then inflation promptly fell and by June 2010 inflation was 1.05% again. The inflation rate spent the next several months bouncing around between 1% and … [Read more...]
Inflation is Officially Back
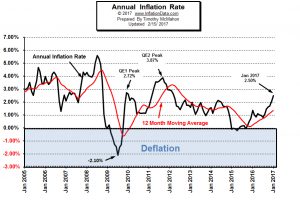
January 2017 saw a 0.6 percent hike in the Consumer Price Index, which pushed the annual inflation rate to 2.5 percent. This is the highest inflation rate in five years. The rate is higher than what many economists had anticipated. After several years of economists worrying that prices might fall, inflation has officially come back for the first time since the peak created by the massive second round of "Quantitative Easing" i.e. QE2 in 2011. QE 1 and QE 2 The first round of Quantitative Easing (QE1) resulted in an inflation rate of 2.72% in 2010 but as soon as the monetary spigot was turned off, the inflation rate fell, so the FED instituted QE2 which then resulted in an inflation rate … [Read more...]
Inflation Skyrockets to 2.5% In January

Annual Inflation is up from 2.07% in December to 2.5% in January. January itself racked up a whopping 0.58% monthly inflation rate. The Bureau of Labor Statistics released the newest inflation numbers on for January on February 15th 2017. Their Consumer Price Index (CPI-U) for all Urban Consumers was 242.839 up from 241.432 in December. Annual Inflation Chart Annual inflation is up from the annual cyclical low of 0.84% in July 2016, August was 1.06%, September rose to 1.46% and October was 1.64%. This is also up from the longer term cyclical low of -0.20% in April of 2015. Although this may look like the beginning of a longer upward trend it is still possible that it is simply a … [Read more...]
December Inflation Rate Finally Tops 2%
For quite some time, I've been saying, that "annual inflation throughout 2016 would remain well below the official FED target of 2% but we are getting closer and it is possible that December could tip the scale above 2%." And that is exactly what happened... annual inflation finished the year at 2.07%! The Bureau of Labor Statistics (BLS) released the data for the month of December on January 18th. They also adjusted four months of data from May through August 2016 due to some faulty data relating to Prescription drug prices but it had no visible effect on the published inflation rates and was only visible if you extended the calculation out to 3 decimal places. Annual Inflation … [Read more...]
November Inflation Up Slightly
The U.S. Bureau of Labor Statistics (BLS) released the monthly and annual inflation rate data for November 2016 on December 15th. The next data release is scheduled for January 15th. The current annual inflation rate is 1.69% up from 1.64% in October. Monthly inflation was actually negative for November but "less negative" than in 2015 causing the Annual Inflation rate to rise. Inflation for the month of November 2016 was -0.16%, while November 2015 was -0.21%. The CPI index was 241.353 in November 2016 down from 241.729 in October. Current Annual Inflation Chart Annual inflation for the 12 months ending in November 2016 was 1.69% up from a cyclical low of 0.84% in July. August was … [Read more...]
