• Home
  • Related Sites
    • Financial Trend Forecaster
      • Moore Inflation Predictor
      • NYSE Rate of Change (ROC)
      • NASDAQ Rate of Change (ROC)
      • Crypto ROC- BTC & ETH
    • Unemployment Data
      • Historical Employment Data
      • Unemployment Rate Chart
      • Labor Force Participation Rate
    • Optio Money
    • Elliott Wave University
    • More Resources
  • Definitions
    • What is Inflation?
    • What is Core Inflation?
    • Inflation vs CPI
    • What is Deflation?
    • What is Disinflation?
    • What is Agflation?
    • What is Stagflation?
    • What is Hyperinflation?
    • What is Quantitative Easing?
    • What is Quantitative Tightening?
    • What is Velocity of Money?
    • What is Fiat Currency?
    • How Do I Calculate Inflation?
    • What are “Sticky Prices” and Why Do They Matter?
  • Featured Content
  • About Us
  • Feedback
    • Sitemap
  • Subscribe Now

InflationData.com

Your Place in Cyber Space for Inflation Data

CPIWidget-Feb26
  • Numerical Inflation Data
    • Current Inflation Rate
    • Monthly Inflation Rate (Moved)
    • Historical U.S. Inflation Rates
    • Historical CPI
  • Inflation Charts
    • Ann. Inf. Rate Chart
    • Long Term Inflation >
      • Ave. Inf. by Decade
      • Total Inf. by Decade
      • Inflation 1913-1919
      • Inflation 1920-1929
      • Inflation 1930-1939
      • Inflation 1940-1949
      • Inflation 1950-1959
      • Inflation 1960-1969
      • Inflation 1970-1979
    • Cumulative Inflation
    • FED Monetary Policy and Inflation
    • Inflation and Recession
    • Confederate Inflation (1861 – 1865)
    • Misery Index
    • The 3 Stages of Inflation
    • 15-Yr Inflation Trends Chart
  • Inflation Calculators
    • Cumulative Inf. Calc.
    • How Much Would it Cost
    • Historical Inflation Calculator since 1774
    • Salary Inf. Calc.
    • U.K. Inf. Calc.
    • Cost of Gas Calc.
    • Net Worth Calc.
    • Lifetime Earnings Calc.
    • Savings Goal Calc.
    • Financial Calculators
  • Inf. Adjusted Prices
    • Energy >
      • Inflation Adj. Gas Prices
      • Historical Oil Prices Chart
      • Crude Oil Price (Table)
      • Natural Gas Prices
      • Electricity Prices
      • Oil vs Gold
    • Gold >
      • Inflation Adjusted Annual Average Gold Prices
      • Gold is a “Crisis Hedge” not an  “Inflation Hedge”
      • Comparing Oil vs. Gold
    • Corn Prices
    • Education Inflation
    • Housing Prices
    • Mortgage Rates
    • NYSE Index
    • Inf. Indexed Bonds
    • Movie Revenues
    • Inflation-Adjusted Wages
  • Cost of Living
    • Calculate Cost of Living
    • Cost-of-living Adj. (COLA)
    • Consumer Price Index CPI
      • Historical CPI
      • Current CPI
      • CPI Release Dates
    • Gas Prices >
      • Cost of Gas
      • Cost of Gas Per Month
      • Gas vs. Oil Price Chart
    • Food Prices 1913 vs 2013
    • Health Insurance
  • Blog
    • Key Inflation Articles
    • International Inflation
    • Historical Inflation Rates for Japan (1971 to 2014)
You are here: Home » Blog » Inflation » December Inflation Rate Finally Tops 2%

December Inflation Rate Finally Tops 2%

Published on January 19, 2017 Updated on March 31, 2021 by Tim McMahon 2 Comments

For quite some time, I’ve been saying, that “annual inflation throughout 2016 would remain well below the official FED target of 2% but we are getting closer and it is possible that December could tip the scale above 2%.”  And that is exactly what happened… annual inflation finished the year at 2.07%!

The Bureau of Labor Statistics (BLS) released the data for the month of December on January 18th. They also adjusted four months of data from May through August 2016 due to some faulty data relating to Prescription drug prices but it had no visible effect on the published inflation rates and was only visible if you extended the calculation out to 3 decimal places.

Annual Inflation September 2015 – December 2016

Inflation 2015-2016

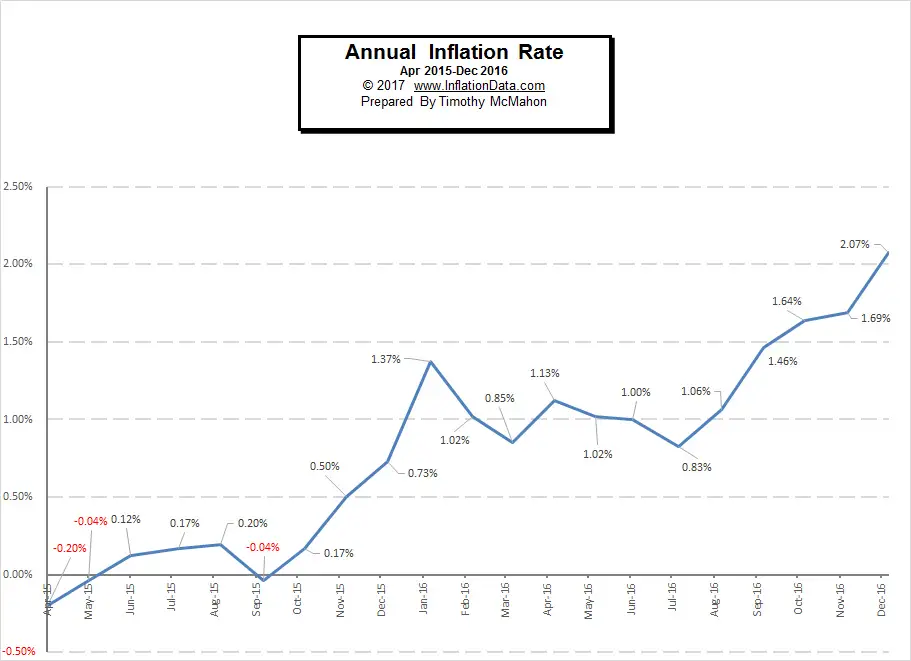
Annual Inflation was negative (Deflation) back in April 2015, from there it tried to rise but then fell back negative in September. But then it only took a few months to reach 1.37% looking like it was going to quickly return to previous levels in the 3% – 5% range. But in spite of the FED setting a target of 2% the inflation rate hovered between 8/10 ths of 1% and just over 1% for the next 7 months. This was primarily due to a collapse in oil prices. Oil went from $38.41 in September 2015 to $39.40 in October but then it began falling reaching $23.58 in February. From there it rebounded to $41.69 in June before falling to $37.98 in September and then rising again to $45.19 in December. So although the correlation isn’t perfect we can see that falling oil prices had an effect on taming inflation for a while.

Long Term Inflation

Annual Inflation Chart

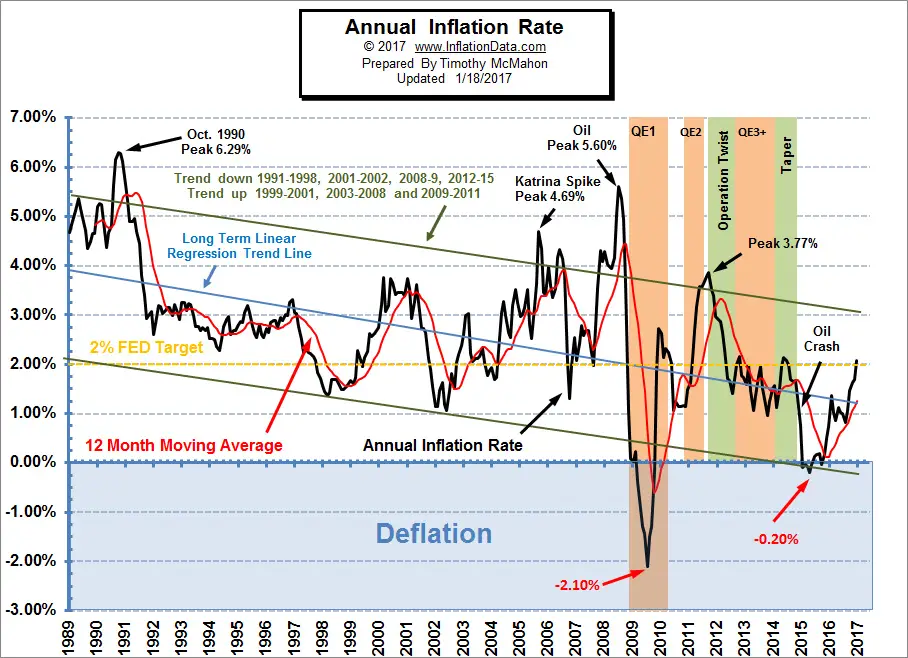
From our Annual Inflation Chart we can see that the long term trend since 1989 has been down although there have been periods of counter trend rallies such as the period from 2002 through 2006 in which it would have been hard to believe that inflation was trending down. It is very possible that we have seen the bottom during the crash of 2009 and inflation will work its way upward again but first it has to decisively break through the long downward channel.

The Moore Inflation Predictor

Moore Inflation Predictor

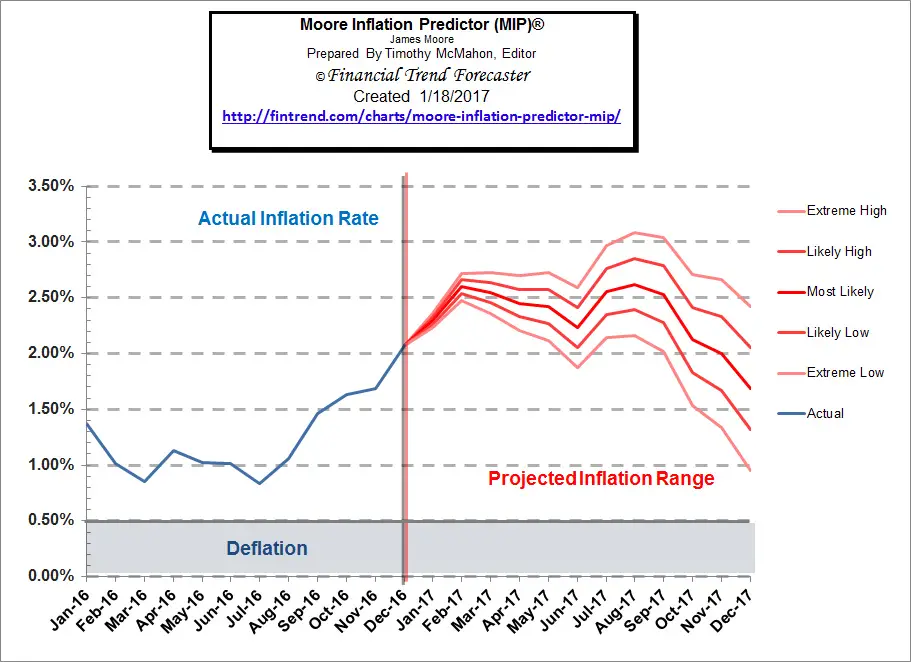
However, if the Moore Inflation Predictor is correct and inflation drops off toward the end of 2017 inflation could remain inside the channel and the long term trend would remain intact.


About Tim McMahon

Connect with Tim on Google+.

  • Web
  • |
  • Twitter
  • |
  • Facebook
  • |
  • LinkedIn
  • |
  • More Posts(410)

Filed Under: Inflation Tagged With: inflation

Comments

  1. Joy Jenkins says

    January 23, 2017 at 2:27 pm

    My hubby and I having a discussion on “inflation” . If th cost of an auto goes up because of American wages vs Mexico, is this inflation as long as the value of USD remains the same? As in USD vs other world monies

    Reply
    • Tim McMahon says

      March 15, 2017 at 10:44 am

      Joy,
      Good question! There are a variety of reasons that prices may increase. The primary one is an increase in the money supply. But with the current global economy another cause could be currency fluctuations. In your example, if the Mexican Peso devalues against the U.S. Dollar that would cause an increase in the cost of Mexican produced goods. The problem comes in the definition of Inflation since the word is used sloppily to mean both Price Inflation and Monetary Inflation. See: What is the Real Definition of inflation?

      Reply

Leave a Reply Cancel reply

Your email address will not be published. Required fields are marked *

This site uses Akismet to reduce spam. Learn how your comment data is processed.

Latest Posts

  • Inflation Down In January 2026
  • BLS Inflation Data Delayed
  • Updated Cumulative Inflation Calculator
  • Inflation-Adjusted Silver Prices
  • December Inflation Down Slightly, Not Flat
  • December 2025 Inflation Report for November
  • How Deflation Created the Middle Class
  • October Inflation Numbers Delayed

Sponsored:

As a Seasoned Investor I thought I'd seen everything... But recently I discovered TradingView which has really improved the information I have at my fingertips.~ Tim McMahon, editor

TradingView gives me an edge... including powerful charting tools, real-time market data, and a global community of traders—all in one easy to use platform. It has hundreds of indicators, and even custom scripts for more advanced users, and you don't need to change Brokers just use its seamless brokerage integration... TradingView isn't just a charting tool—it's your full trading command center.

Trade smarter. Trade faster. Check Out TradingView for free.

----------

The Best Place to Buy Your Crypto

Coinbase is the largest Crypto Trading platform in the U.S. and the easiest to use. ~Tim McMahon, editor

Check out Coinbase here

Subscribe Now

eTrends Signup Form

Elliott Wave Resources

Free Elliott Wave Resources

What is Waveopedia?

Waveopedia is EWI’s free, comprehensive index of Elliott wave patterns and terms. Everyone from beginners to experts can benefit from it. It’s a great place to send your followers if they’re new to Elliott waves.

  • Deflation Hits China is the U.S. Next?

  • Why You Must Avoid the Herding Trap

  • Chasing Trends Can Cost You

  • More Education Resources

Post Archives

Home | Articles | Sitemap | Terms of Service | Privacy | Disclaimer | Advertise With Us

Copyright © 1996-2026 · Capital Professional Services, LLC · Maintained by Design Synergy Studio · Admin

Do Not Sell My Personal Information