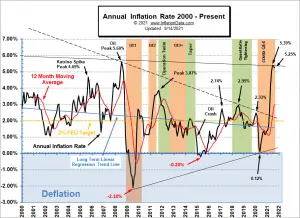
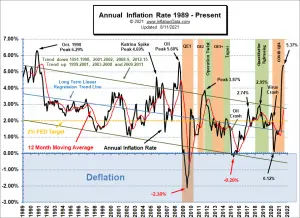
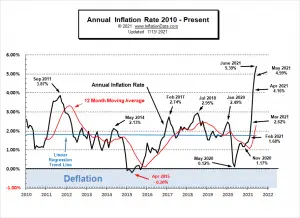
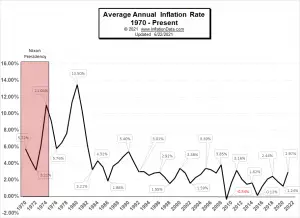
On September 14th, 2021, the Bureau of Labor Statistics said that in August 2021, the Annual Inflation Rate was down. Inflation Summary: Annual Inflation was 5.25% in August, 5.37% in July, and 5.39% in June. CPI Index rose from 273.003 in July to 273.567 in August. Monthly Inflation for July was 0.48% and 0.21% for August. Next release October 13th Inflation for the 12 months ending in August was down 0.12% from July. Since the BLS rounds to 1 decimal place, they reported June and July as 5.4% and August as 5.3%. The last time inflation was this high was the 5.6% of July 2008. Prior to that, we have to go all the way back to the 6.29% of October 1990 to find a higher … [Read more...]
How to Prepare for Inflation
With inflation reaching heights not seen in many years, people are wondering... How to prepare for inflation? And What effects will inflation have on our investments? Between 2020 and 2021, inflation steadily increased from a minuscule 0.12% in May of 2020 to just under 5.4% in June and July of 2021. Although 5+% may not seem like much, it means that prices are 5% higher than they were a year ago. If inflation stays at 5%, you might think it has stabilized, but unfortunately, inflation compounds. So if the inflation rate is still at 5%, next year's prices are now more than 10% higher than last year. So, for instance, after 1 year at 5% inflation, a $100 item now costs $105, but after another … [Read more...]
Hyperinflation Strikes Lebanon… Again
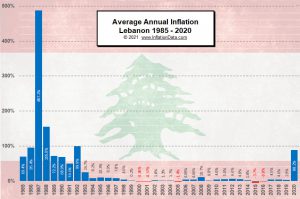
Lebanon's economy is crashing and burning... literally. Fiery protests began in August 2019, in the wake of youth unemployment reaching 37% and the general unemployment at 25%. This was even before the entire world shut down due to COVID. And this was just the beginning of hyperinflation for Lebanon. In 2019 Lebanon's inflation rate averaged a reasonable 2.9% for the entire year, but by July 2020 Lebanese inflation was well into hyperinflationary territory at 112.39%. So prices were moving up so fast they had more than doubled from July 2019 through July 2020. And from there it got worse. From August 2019 through August 2020 prices were up over 120%. And remember that the average for 2019 … [Read more...]
BLS says July Inflation Holds Steady at 5.4%
The U.S. Bureau of Labor Statistics released their Consumer Price Index News Release for the month of July on August 11th, 2021. Inflation Summary: Annual Inflation 5.37% virtually identical to June's 5.39% CPI Index rose from 271.696 in June to 273.003 in July. Monthly Inflation for June was 0.93% and July was 0.48%. Next release September 14th Inflation for the 12 months ending in July was 5.37% identical to August 2008, July 2008 was the previous Peak at 5.60% Last month's 5.39% was the largest increase since August 2008's 5.37%. (Since the BLS rounds to 1 decimal place they reported last month, this month, and August 2008 as 5.4%). If inflation tops the 5.6% of July … [Read more...]
The Relationship Between Inflation and Interest Rates: Explained
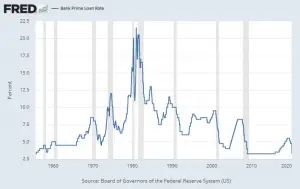
"Macroeconomics" deals with the "big picture" of how things fit together in the economy as a whole, while "microeconomics" deals more with how it affects the individual. Here at InflationData, we generally look at the macro side and leave the economics of the individual to our sister sites like Your Family Finances. Today we are going to look at the macroeconomic implications of the link between inflation and Interest rates. ~Tim McMahon, editor The Macroeconomic Link Between Inflation and Interest Rates By George J. Newton Price Inflation is the rate at which the price of goods and services rises in the economy over a period of time. Monetary inflation is the increase in the money … [Read more...]
How Can Inflation Affect Businesses?
Inflation can affect business in strange ways. It can be good for business in small doses, but it can also be disastrous if it devolves into hyperinflation. Hyperinflation is often described as massively increasing prices over a very short period of time, for example, in America during the Civil War. But even if inflation doesn't get that bad, the later stages of ordinary inflation such as we saw in the 1980s can still be devastating to businesses. Here are four ways that businesses are affected by inflation or hyperinflation, and what that might mean for their customers and other services they might invest in. #1 It Can Increase Sales In the short run, as the money supply increases, … [Read more...]
Inflation and Bonds
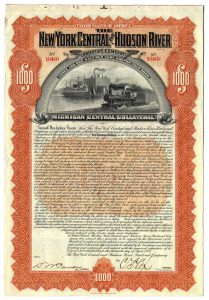
What are Bonds? Bonds are a type of "debt instrument" frequently issued by corporations and governments. Typically they have a "par value" of 100 (or 1000). Par value, aka. "nominal value" is the face value of a bond. However, bonds can trade at a premium or discount to face value but at the end of its term, the borrower (i.e. government or corporation) must pay the lender (i.e. investor, aka. creditors or debtholders) the face value. During the term of the loan, the borrower makes interest payments to the lender based on the face value and the listed interest rate (aka. coupon rate). Bonds can be issues for fairly long terms i.e. 20 or 30 years so interest rates can change drastically … [Read more...]
June 2021: Highest Annual Inflation since 2008
Inflation Summary: Annual Inflation up sharply to 5.39% CPI Index rose from 269.195 in May to 271.696 in June. Monthly Inflation for March 0.71%, April 0.82%, May 0.80%, and June was 0.93% . Next release August 11th Inflation for the 12 months ending in June was 5.39% for the Largest Annual Increase since July 2008's 5.60% Last month's 4.99% was the largest increase since August 2008's 5.37% but at 5.39% June 2021 was actually slightly higher than that. (Although the BLS reported them both as 5.4%). If inflation tops the 5.6% of July 2008, we have to go all the way back to the 6.29% of October 1990 to find a higher peak. We have been predicting Annual Inflation would … [Read more...]
Oil vs. Gold- Why Compare Commodity Prices Against Each Other?
When we think of inflation we generally think of "Price Inflation" i.e. how much the price of a good or service has increased in dollars. However, price inflation is not "monolithic" that is, they don't all increase at exactly the same rate. Some prices will increase faster or more than others. So it is often useful to compare the price of one commodity to another to see the relative increases of each. Over the years we have compared a variety of different commodities including Gasoline vs. Oil and Oil vs. Bitcoin. We've even done a 3-way comparison of Gold vs. Dollar vs. Bitcoin. But since gold is historical money it is useful to use it as the standard yardstick. So we have updated … [Read more...]
How Does a Country “Export” its Inflation?
This question is interesting because most countries can’t just export their inflation because their currency is exclusive to their country. However, the U.S. is in the unique position of being the “reserve currency” of the world. In addition, several countries like Panama, Ecuador, and Zimbabwe, actually use the U.S. dollar as their currency and don’t even have their own currency at all. So the U.S. currency has a greater than normal influence on other country's economies. Exporting inflation is a Government's dream scenario. If they could print all the money they wanted and not suffer the consequences of their actions, it would be a dream come true for politicians. Printing money boosts … [Read more...]

