
What are Bonds?
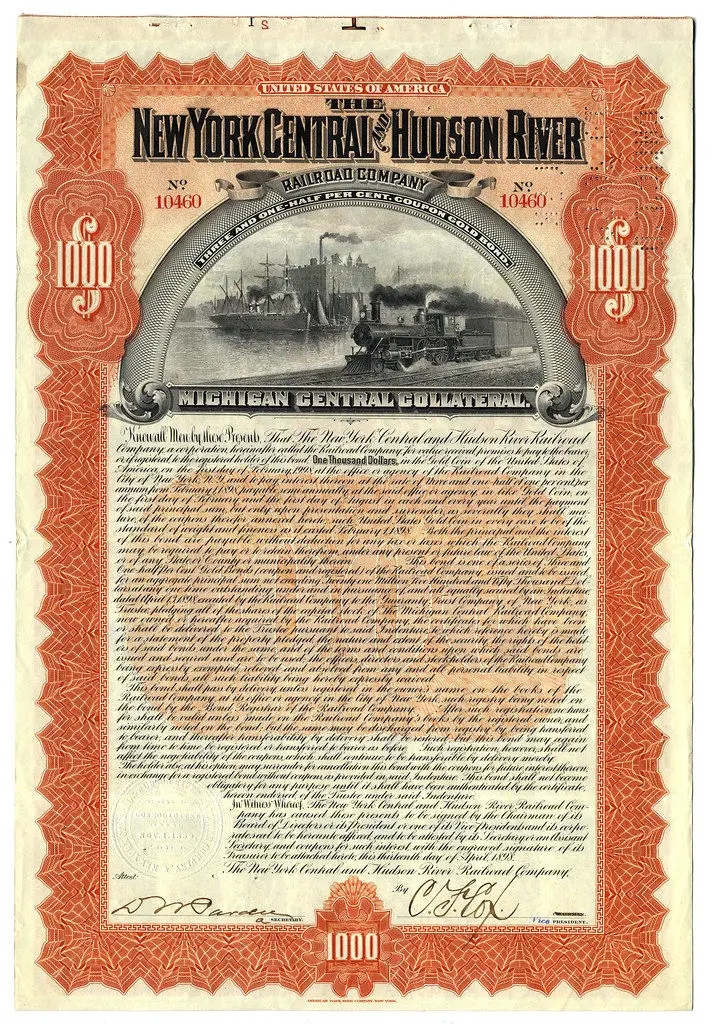
1898 New York Central & Hudson Bond Certificate
Bonds are a type of “debt instrument” frequently issued by corporations and governments. Typically they have a “par value” of 100 (or 1000). Par value, aka. “nominal value” is the face value of a bond. However, bonds can trade at a premium or discount to face value but at the end of its term, the borrower (i.e. government or corporation) must pay the lender (i.e. investor, aka. creditors or debtholders) the face value. During the term of the loan, the borrower makes interest payments to the lender based on the face value and the listed interest rate (aka. coupon rate). Bonds can be issues for fairly long terms i.e. 20 or 30 years so interest rates can change drastically during that period.
The coupon rate is determined at the time of issue based on prevailing interest rates, the issuer’s credit rating, and the length of time until maturity. So a short-term bond issued by a highly regarded entity will have the lowest coupon rate attached to it. So typically, the bonds that pay the lowest interest are short-term U.S. Treasury bills followed by Longer-term Treasurys, like the benchmark 10-year note. Corporations generally are considered higher risk (since they can’t just print money to pay their bills) so they must pay a higher interest rate to compensate for the greater risk. “Junk bonds” pay the highest interest because their issuers are not considered to be a good credit risk.
What Happens When Interest Rates Fluctuate?
Over time as bonds age, market interest rates will rise and fall. So somehow bonds that are sold before maturity must adjust to these changes. So, if a bond was issued at a 5% coupon rate but interest rates rise but the company’s creditworthiness remains the same no one would want to buy these bonds because they could get a better rate on newly issued bonds. The company is only contractually obligated to pay the bondholder 5% so the investor would be stuck with the bond until maturity unless he can make the bond more worthwhile to a buyer. So what does he do? He lowers the price. So if the bond was originally issued at $1000 he might sell it for $900. So the buyer will still receive 5% of $1000 (i.e. $50) in interest payments but he really only invested $950 so his real rate of return is $50/$950 = 5.5%. But if he holds to maturity he will get the full $1000 payment from the issuer. So the yield to maturity would actually be higher than 5.5% depending on how much longer to maturity.
Conversely, if prevailing interest rates go down the owner of the bond can ask more than the face value because the issuer is still paying the higher interest rate on the face value. The disadvantage is that if held to maturity the new owner will still only get the actual face value. The too is taken into consideration when calculating the yield to maturity. So the key to remember is “interest rates up bonds down” and “interest rates down bonds up”.
How does Inflation Affect Bonds?
Now that we understand how interest rates affect bond prices we can look at how inflation affects bond prices. As inflation heats up interest rates also rise in order to compensate a lender for receiving depreciated money back at the end of the loan. The higher the inflation rate the more interest required to induce a lender to part with their money for a long period of time. Knowing that higher interest rates cause bond values to decline we can see that higher inflation rates will also cause bond prices to fall for two reasons:
- Higher inflation drives up interest rates.
- Higher inflation deters investors from tying up their money for long periods.
How Do Bond Issuers Mitigate Inflation Risk to Encourage Bond Buying?
The U.S. government came up with a strategy to encourage investors to buy their bonds even in times of higher inflation. And that was to “index” the coupon rate to the level of inflation. Basically, as inflation increases, these special inflation-indexed bonds actually increased their interest rates. As we said in, Should I Invest in Inflation-Indexed Bonds? “Inflation series I bonds are purchased at face value. Unlike zero-coupon bonds or T-Bills, you cannot buy inflation series bonds at a discount. Instead, interest rates paid are based on a sort of complex formula made up of two components. The first component is a base interest rate and it remains the same for the life of the bond. The second component is an inflation adjustment that is calculated every May and November. When inflation is high this will boost the return on your i-Series Inflation Indexed bond.” Unfortunately, in exchange for this inflation insurance I-Bonds tend to pay a lower starting rate so if inflation doesn’t rear its ugly head you will actually earn less than you would have with a normal bond.
Advantages of Bonds
Despite the disadvantages of locking your money away and the inflation risk, bonds issued by solvent corporations and governments are actually considered “low risk” because bondholders are considered creditors so they get paid before “owners” i.e. stockholders. So should a company fall on hard times bondholders are still usually paid. Also if held to maturity bondholders know exactly how much they will be getting there is no risk of falling stock prices. (Of course, if you sell before maturity during a time of rising interest rates you could still lose money). But by buying bonds close to their maturity date you can mitigate this risk.
Another advantage of bonds is that they generally have very low transaction costs. For instance, Saxo markets only charge a 0.20% commission on both corporate and government bonds for its lowest tier customers. Bigger customers might only pay 0.10% or even 0.05%.
The best time to buy bonds is when interest rates are getting ready to fall but the market hasn’t caught on yet. Another bond investment strategy is to buy bonds that are nearing maturity but are selling at a discount. By looking at the yield to maturity you might be able to find a bargain, as long as you are sure that the issuer will be solvent at the maturity date.
You might also like:
- Should I Invest in Inflation-Indexed Bonds?
- Impact of Inflation on Bonds Part 1
- Effect of Inflation on Bonds Part 2
- How Have Inflation-Indexed Bonds Really Performed?

Leave a Reply