
On September 22, 2021, the Federal Reserve reported its current policy position. Currently, the FED is creating liquidity (i.e., printing money) through its Quantitative Easing (QE) program at the rate of $120 billion per month. The market has been fearing that the FED would begin tapering, i.e., cutting back on its liquidity creation. Rumor was that the FED would start reducing their QE by $10-$15 billion per month due to inflation concerns.
The last time the FED embarked on a tapering plan back in 2017, they used a two-prong approach of raising the FED Funds rate and reducing the monthly printing by $10 Billion every three months (i.e., roughly $3.3 billion per month). The result of that QT program was that the NYSE peaked shortly after the FED began tightening. The NYSE peaked at 13,637 in January 2018.
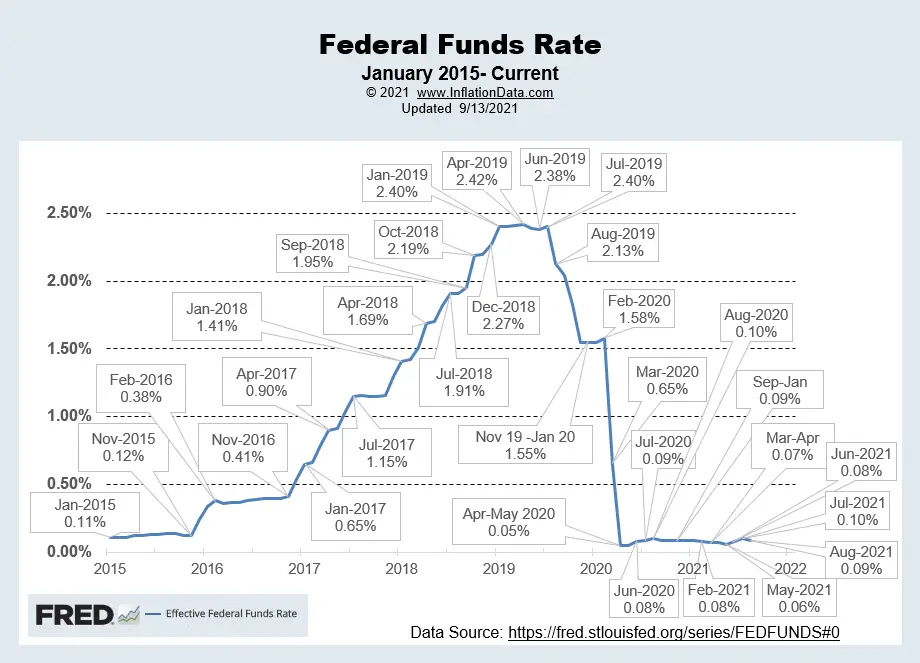
As we can see from the chart below, throughout 2017, the FED increased the FED funds rate (i.e., the rate at which it loans money to banks) from 0.65% in January 2017 to 1.41% in January 2018.
While they were doing this, money creation looked basically flat on this long-term chart, but…
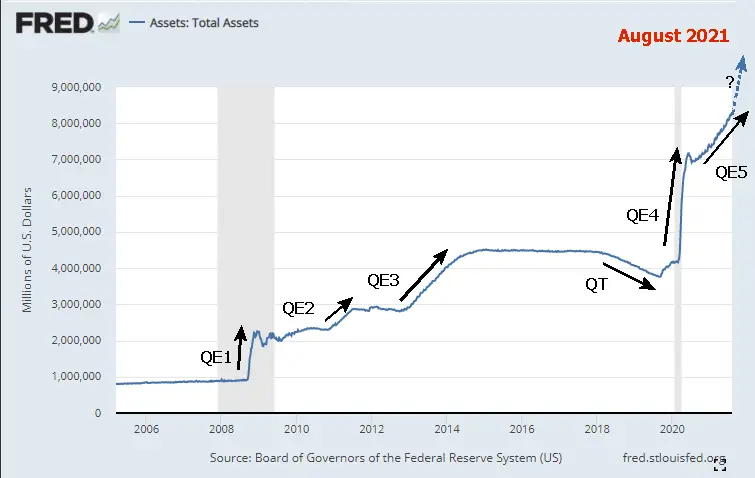
If we look at a close-up view of just 2017, we see that the tapering was beginning.
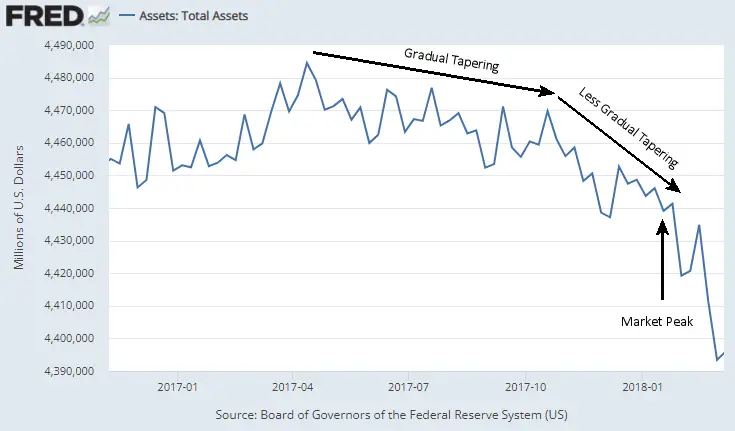
And the market continued to go up. But then, in 2018, the FED got serious about reducing assets by not reissuing debt, aka. Quantitative Tightening (QT). So what looks like a relatively minor decline on the long-term chart above actually eliminated about 1/3rd of QE3. But it didn’t get anywhere near eliminating Q1 and Q2.
As a result, the market fell to 10,724 by December 2018, which was a 21.3% drop.
![]()
So the prospect of another massive cut by the FED had the market spooked. In 2019, the FED was also spooked at the market drop and began reversing course. And then, in 2020, they started another massive easing program to combat the effects of the COVID shutdown. Previous QE programs didn’t result in massive inflation because of the deflationary forces in place at the time, i.e., the 2008 stock market crash, which eliminated trillions in capital. But without deflationary pressures, all that money creation has to drive up prices somewhere, whether in the stock market or consumer prices.
Federal Reserve September 22, 2021, FOMC Statement
In an effort to not spook the market, the FED released the following statement. “The Federal Reserve is committed to using its full range of tools to support the U.S. economy in this challenging time, thereby promoting its maximum employment and price stability goals.” Then they reiterated their commitment to a 2% inflation rate and their belief that the current inflation spike is “transitory”.
They fudged their 2% target by saying that they’re targeting an “Average” of 2%. And since inflation was well below 2% for a while it’s OK if it is now above 2% for a while. Regarding the FED funds rate they said, “The Committee decided to keep the target range for the federal funds rate at 0 to 1/4 percent and expects it will be appropriate to maintain this target range until labor market conditions have reached levels consistent with the Committee’s assessments of maximum employment and inflation has risen to 2 percent and is on track to moderately exceed 2 percent for some time.” So, although inflation is currently above 2% they don’t appear to be considering raising the FED funds rate.
Regarding Quantitative Easing:
Their comments on quantitative easing were: “Last December, the Committee indicated that it would continue to increase its holdings of Treasury securities by at least $80 billion per month and of agency mortgage‑backed securities by at least $40 billion per month until substantial further progress has been made toward its maximum employment and price stability goals. Since then, the economy has made progress toward these goals. If progress continues broadly as expected, the Committee judges that a moderation in the pace of asset purchases may soon be warranted. ”
So the FED is keeping their options open, but specifically, they will:
- Keep the FED Funds rate under 1/4 percent. (Recently, it has been under 1/10th percent.
- Continue increasing Treasury Securities by $80 Billion/month and continue increasing mortgage-backed securities (MBS) by $40 billion per month.
- Continue rolling over current debt (i.e. NO Tapering).
With their fears of the FED’s tightening relieved the market rebounded from the September 20th low of 15,988 to close on Friday September 24th at 16.539 slightly down from Thursday’s high of 16,627. So the party may continue for a little longer. But the market is still below the September 2nd high of 16,944 and the NASDAQ ROC chart has issued a sell signal.
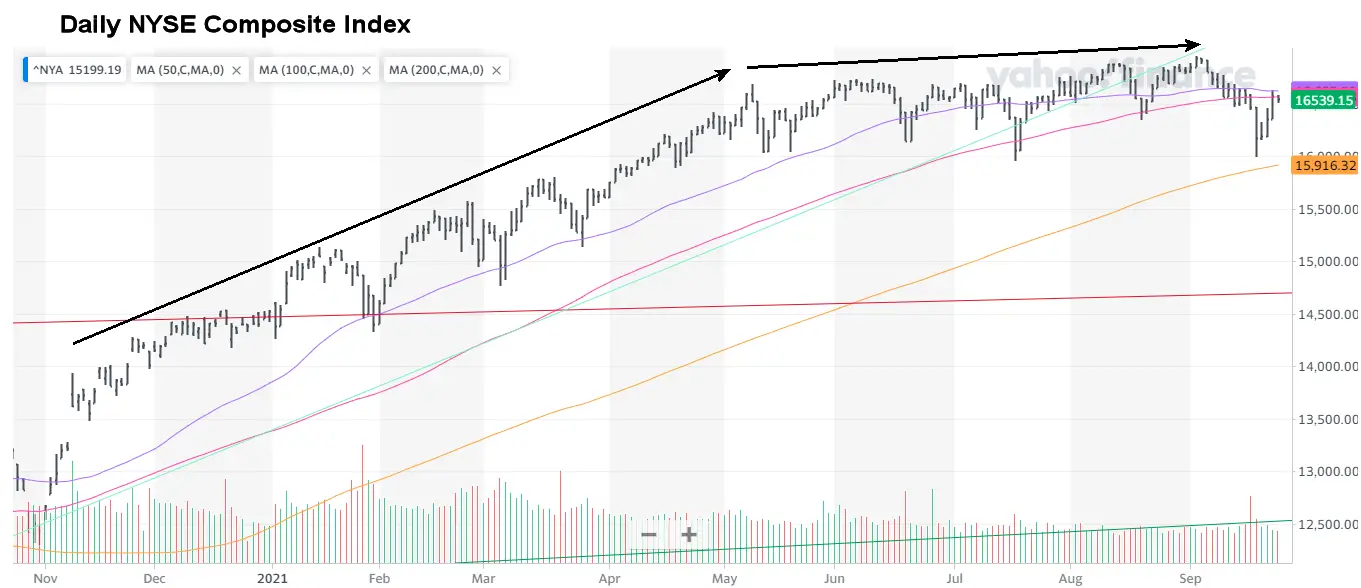 After the sharp rebound in 2020-21, the NYSE has gone virtually nowhere since May, which isn’t all that unusual. The old saying “sell in May and go away” definitely applied this year. And the recent drop brought the index very close to the 200-day moving average which was below the 50 and 100-day averages. The market is currently testing both of those averages. If it can’t break above or if the 50-day crosses below the 100-day average the NYSE will be looking much weaker.
You might also like:
- What is Quantitative Easing?
- What is Quantitative Tightening?
- What is Velocity of Money?
- What is Fiat Currency?
- Current Market Situation- NYSE Rate of Change
- FED Total Assets
- FED Funds Rate
- Various Components of FED Assets (Use Pulldown to view “Selected Assets”)

Leave a Reply