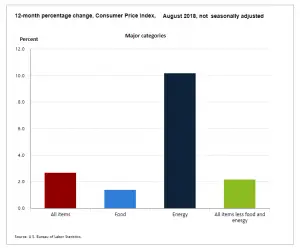
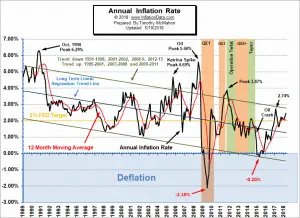
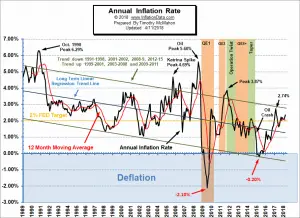
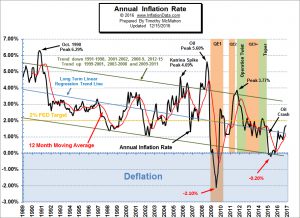
On September 13th 2018, the U.S. Bureau of Labor Statistics released their monthly Consumer Price Index report on the status of Inflation for the 12 months through the end of August. Annual Inflation is Down Annual inflation in August was 2.70% down from 2.95% in July and 2.87% in June. (BLS rounds both to 2.9%) CPI was 252.146 in August, 252.006 in July and 251.989 in June. Monthly Inflation for August was 0.06%, July was 0.01%, and June was 0.16% compared to 0.30% in August 2017. Next release October 11th Monthly Inflation: Annual inflation for the 12 months ending in August was 2.70%. 2.95% up from 2.87% in June. The U.S. Bureau of Labor Statistics (BLS) rounds … [Read more...]
July Inflation Up a Fraction
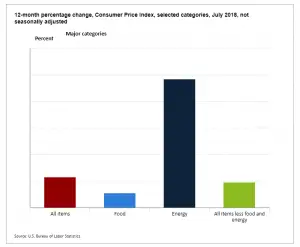
On August 10th 2018, the U.S. Bureau of Labor Statistics released their monthly Consumer Price Index report on the status of Inflation for the 12 months through the end of July. Annual Inflation is Up Very Slightly Annual inflation in July was 2.95% up slightly from 2.87% in June. (BLS rounds both to 2.9%) CPI was 252.006 in July and 251.989 in June. Monthly Inflation for July was 0.01%, and 0.16% in June compared to -0.07% in July 2017. Next release September 13th Monthly Inflation: Annual inflation for the 12 months ending in July was 2.95% up from 2.87% in June. The U.S. Bureau of Labor Statistics (BLS) rounds both to 2.9% and accordingly reports the inflation rate … [Read more...]
Annual Inflation Up Slightly in June
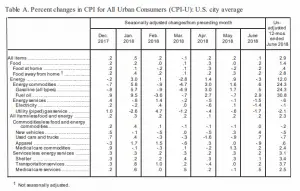
The U.S. Bureau of Labor Statistics released the Annual Inflation Rate data for the year through the end of June on July 12th 2018. Annual Inflation is Up Annual inflation rate was 2.87% in June up from 2.80% in May, 2.46% in April, 2.36% in March and 2.21% in February. CPI-U was 251.989 in June, 251.588 in May, 247.867 in January and 246.524 in December. Monthly Inflation for June was 0.16% while May was 0.42%, April was 0.40%, up from 0.23% in March 2018. June 2017 was only 0.09% Next release August 10th Monthly Inflation: Annual inflation for the 12 months ending in June was 2.87% up slightly from May's 2.80% but up sharply from April's 2.46%. Current levels are … [Read more...]
Annual Inflation Up Sharply in May
The U.S. Bureau of Labor Statistics released the Annual Inflation Rate data for the year through the end of May on June 12th 2018. Annual Inflation is Up Annual inflation rate was 2.80% in May up from 2.46% in April, 2.36% in March and 2.21% in February. CPI-U was 251.588 in May, 250.546 in April, 249.554 in March, 248.991 in February, 247.867 in January and 246.524 in December. Monthly Inflation for May was 0.42%, April was 0.40%, up from 0.23% in March 2018. May 2017 was only 0.09% Next release July 12th Monthly Inflation: Annual inflation for the 12 months ending in May was 2.80% up sharply from April's 2.46% the increase was primarily because May 2017's … [Read more...]
April Inflation UP
The U.S. Bureau of Labor Statistics released the Annual Inflation Rate data for the year through the end of April on May 10th 2018. Annual Inflation is Up Annual inflation rate was 2.46% up from 2.36% in March and 2.21% in February. CPI was 250.546 in April, 249.554 in March, 248.991 in February, 247.867 in January and 246.524 in December. Monthly Inflation for April was 0.40%, up from 0.23% in March 2018 Next release June 12th Monthly Inflation: Annual inflation for the 12 months ending in April was 2.46% up from 2.36% in March. February was 2.21% and January was 2.07%. Early in 2017 inflation was 2.50% in January, 2.74% in February and 2.38% in … [Read more...]
March Inflation Data Released
The U.S. Bureau of Labor Statistics released the Annual Inflation Rate data for the year through the end of March on April 11th 2018. Annual Inflation is Up Annual inflation rate was 2.36% up from 2.21% in February. CPI was 249.554 in March, 248.991 in February, 247.867 in January and 246.524 in December. Monthly Inflation for March 2018= 0.23% Monthly Inflation for March 2017= 0.08% Next release May 10th Monthly Inflation: Typically the monthly inflation rate is highest during the first quarter (January through March) and lowest during the last quarter (October through December). March 2018 had 0.23% monthly inflation which was below February's 0.45% but it … [Read more...]
Inflation Up, NYSE New High
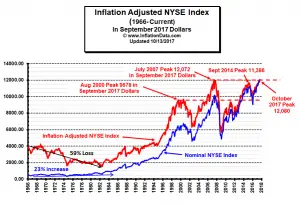
Current Inflation Situation On October 13th the Bureau of Labor Statistics released the Consumer Price Index inflation information for September. The CPI-U index was 246.819 up from 245.519 in August. This resulted in an annual inflation rate for the 12 months through September 2017 of 2.23% up from 1.94% in August, 1.63% in June and 1.73% in July. Monthly inflation was a whopping 0.53% for September primarily due to a 12% increase in gasoline prices due to refinery shutdowns in response to hurricanes. See our Annual Inflation Chart for more info. NYSE Makes New High in Inflation Adjusted Terms! To get a true picture of the state of the market it helps to look at the … [Read more...]
Inflation Reaches Highest Level in 5 Years
On Wednesday March 15th the U.S. Bureau of Labor Statistics (BLS) released their monthly Inflation report for the 12 months ending February 28th . The Consumer Price Index (CPI-U) came in at 243.603 up from 242.839 in January. This resulted in a 0.31% monthly inflation and 2.74% annual inflation. The last time the annual inflation rate was this high was in February of 2012 when it was 2.87%. After a deflationary period from March through October 2009, massive quantitative easing, caused a 2 month flirtation with inflation nearing 3% but then inflation promptly fell and by June 2010 inflation was 1.05% again. The inflation rate spent the next several months bouncing around between 1% and … [Read more...]
November Inflation Up Slightly
The U.S. Bureau of Labor Statistics (BLS) released the monthly and annual inflation rate data for November 2016 on December 15th. The next data release is scheduled for January 15th. The current annual inflation rate is 1.69% up from 1.64% in October. Monthly inflation was actually negative for November but "less negative" than in 2015 causing the Annual Inflation rate to rise. Inflation for the month of November 2016 was -0.16%, while November 2015 was -0.21%. The CPI index was 241.353 in November 2016 down from 241.729 in October. Current Annual Inflation Chart Annual inflation for the 12 months ending in November 2016 was 1.69% up from a cyclical low of 0.84% in July. August was … [Read more...]
Deflation Returns in September
The Bureau of Labor Statistics (BLS) released their inflation numbers for the year ending September 30th on October 15, 2015. Monthly inflation was negative (disinflationary) for the second month in a row resulting in annual deflation of -0.04%. Although at this level the deflation is so slight that the BLS rounds it to Zero. So basically prices are on par with those of a year ago. However, that doesn't mean that all prices are identical to those of a year ago. In the report issued by the BLS yesterday we note that food prices are up 1.4% over a year ago while energy prices are down -18.4%. and all other items excluding food and energy are up 1.9% so we see that the primary cause of the … [Read more...]

