
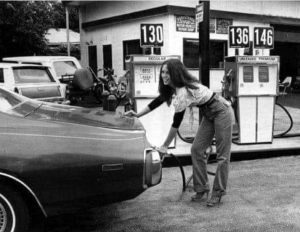
June 10, 2022 Update: AAA says the national average is now almost $5.00 a gallon (and much higher in places like California). That moves the blue dot on the chart below up and prices are now well above inflation-adjusted peaks! June 2, 2022 It's no secret that gasoline prices are skyrocketing. However, a couple of months ago we said that although gas prices were high and rising, they still weren't at record levels when looked at in inflation-adjusted terms. But all that has changed now as gasoline prices continue to climb upward. Today the AAA reported the highest national gas prices they have recorded. Although this is a significant development, all sorts of … [Read more...]
Oil vs. Gold- Why Compare Commodity Prices Against Each Other?
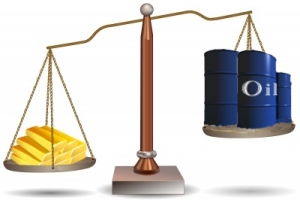
When we think of inflation we generally think of "Price Inflation" i.e. how much the price of a good or service has increased in dollars. However, price inflation is not "monolithic" that is, they don't all increase at exactly the same rate. Some prices will increase faster or more than others. So it is often useful to compare the price of one commodity to another to see the relative increases of each. Over the years we have compared a variety of different commodities including Gasoline vs. Oil and Oil vs. Bitcoin. We've even done a 3-way comparison of Gold vs. Dollar vs. Bitcoin. But since gold is historical money it is useful to use it as the standard yardstick. So we have updated … [Read more...]
Oil Price Inflation Charts and Tables Updated
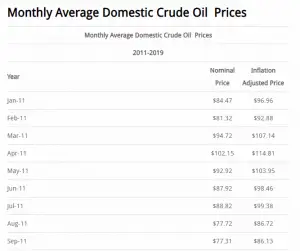
Oil Price Inflation This month we have updated the Crude Oil Inflation Chart which shows historical crude oil prices and also what they would be if you adjusted them for inflation as of February 2019. We have also updated the Annual Crude Oil Prices Table and the Monthly Crude Oil Prices Table both of which also show prices adjusted for inflation. The nominal price of a barrel of oil was only $1.37 back in 1946 but the inflation adjusted price of oil was $18.92 per barrel. (The nominal price is the price you would have actually paid at the time). The major peaks occurred in December 1979, October 1990, and June 2008 at $125.23, $65.68, and $145.93 respectively (all inflation adjusted to … [Read more...]
How Oil Prices Affect Inflation
For a very long time, the prices of oil and inflation have been closely related to each other. When the value of the precious black liquid goes up, inflation follows in the same direction. The reason for this is because oil is a major commodity that's linked to a lot of things. Oil is used to heat homes, power public utilities, as well as run factories it is also a direct component in things like plastics. That being said, if the input cost for oil rises, so will the costs of finished products and services. The direct association between oil and inflation was first recorded in the 70s. It was at the time when the cost per barrel rose from $3 in 1973 to $40 in the 1979 oil crisis. This … [Read more...]
Crude Oil and Gold
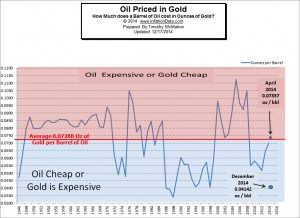
Because inflation decreases the value of of money, in order to have a “yard stick” of constant value it is necessary to use the inflation adjusted price when we consider the price of a commodity like Oil. Here at InflationData we have provided a variety of charts of the inflation adjusted price of commodities like Oil, Gasoline, Electricity, Natural Gas, Stock Market, Housing Prices, Education Costs and much more. But each of these requires you to rely on potentially flawed inflation statistics generated by some outside agency or government. If that agency has an agenda other than accuracy your cost estimates could be flawed. But there is an alternative and that is to compare your … [Read more...]
Oil, Petrodollars and Gold
For thousands of years gold has been synonymous with money, albeit with periods where governments mandated other mediums of exchange. Therefore, throughout history prices were measured in gold rather than in dollars, Rubles or Yen. By looking at the chart to the right you can see the current price of gold over the last 24 hours in terms of dollars. As of this writing it is $1256.70 per troy ounce but gold has fallen from its monetary pedestal and now fluctuates just as other commodities. The Fall of Gold and Rise of the Dollar Shortly after assuming office in 1933, President Franklin Roosevelt perpetrated one of the greatest frauds ever on the American public. He knew that the … [Read more...]
Gasoline 20 Cents a Gallon?
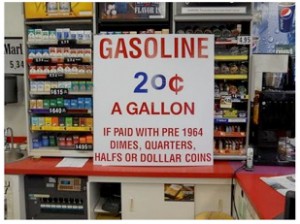
Many of us aren't old enough to remember Gasoline at 20 cents a gallon. I can remember gas during the 1960's at 29.9 cents a gallon. The last time that gasoline averaged 20 cents a gallon was in 1942. That was during WWII ! But if you know us here at InflationData.com you probably know that we usually talk in inflation adjusted prices. So adjusting for inflation, the price of gas in 1942 would have been $2.78 if you are paying in January 2012 dollars. But that is still a long way away from the average price of Gas in 2011 of $3.48. We track the inflation adjusted price of gasoline based on the annual average price using the Consumer Price Index (CPI) generated by the U.S. Bureau of Labor … [Read more...]
Falling Oil Prices: Worrying Trend or Saving Grace?
By Marin Katusa, Casey Energy Team When oil prices start to decline, investors and economists get worried. Oil prices in large part reflect global sentiment towards our economic future – prosperous, growing economies need more oil while slumping, shrinking economies need less, and so the price of crude indicates whether the majority believes we are headed for good times or bad. That explains the worry – those worried investors and economists are using oil prices as an indicator, and falling prices indicate bad times ahead. But oil prices have to correct when economies slow down, or else high energy costs drag things down even further. And the current relationship between oil prices and … [Read more...]
Casey Research Identifies Next Generation of Resource Leaders with Casey’s NexTen
Stowe, VT, October 12, 2010 – Casey Research, a leader in providing in-depth, independent analysis of high-growth investment opportunities, announced today Casey’s NextTen, the next generation of leaders in the natural resource industry. Successful investors, like Casey Research founder Doug Casey, have long recognized that there are no more important considerations when investing than the people. For years, Casey Research has helped its subscribers succeed by closely following the careers of the most successful explorers in the industry, those top few percent who consistently generate the majority of returns for shareholders. And now, it is proud to present the next generation of … [Read more...]
Is Natural Gas Cheap?
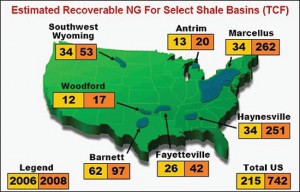
By David Galland, Casey Research At the height of its late 2005 rally, natural gas in the U.S. was selling for just over $16/MMBtu, 350% higher than today’s price of $3.56. The oil/gas ratio, now over 18, is an all-time high… suggesting that natural gas is dirt cheap. So, it’s a buy, right? In a phrase, not exactly. According to a recent report by Natural Gas Intelligence, U.S. natural gas available for production “has jumped 58% in the past four years, driven by improved drilling techniques and the discovery of huge shale fields in Texas, Louisiana, Arkansas and Pennsylvania, according to a report issued Thursday by the nonprofit Potential Gas Committee (PGC).” According to the … [Read more...]