The 15 Year Inflation Cycle
Inflation like everything else it seems has cycles. It trends up for years and then for almost no reason begins falling again. After a while it rises again.
Unfortunately, while it is doing its long term dance it is bouncing up and down creating so much "noise" that it is difficult to see the longer term trend.
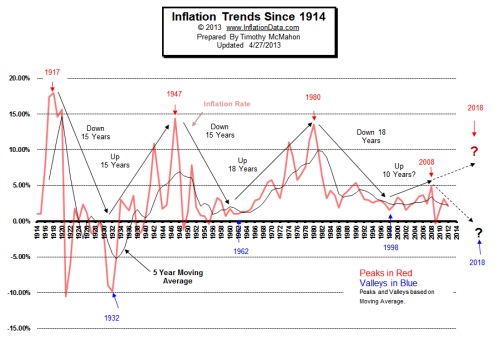
The chart below shows this trend by adding a 5 year moving average to the inflation rate. This smoothens out the noise so we can see the underlying trend. And surprisingly it is actually quite regular.
Click Chart for larger Image
Inflation Cycles Approx. Every 15 Years
From the chart we can see that beginning in 1917 we had 15 years of declining inflation until the bottom in 1932. From there inflation increased for 15 years until 1947.
From 1947 until 1962 (15 Years) inflation rates were trending down. And then for the next 18 years from 1962 until 1980 the trend was moving upward. And just like clockwork the cycle ended and the moving average fell from 1980 through 1998.
So based on that, we would expect approximately 15-18 years of increasing inflation beginning in 1998.
For the first 10 years, the cycle did exactly as expected and it began to rise moving from a low of 1.55% in 1998 to an annual average high of 4.94% in 2008 with individual months reaching 5.6%. But then came the liquidity crisis which drove prices down to deflationary levels. So we have to wonder if the cycle ended in 2008 and began a down trend or whether it is just taking a "breather" like it did many times before and will rocket upward again due to all the money the FED is creating out of thin air?
The Big Question
I've added two question marks to the chart. The first red one is the possibility that the cycle resumes its upward trend for eight more years and completes its 18 year upward cycle to match the 18 down cycle from 1980 - 1998.
The second one is that the cycle ended in 2008 as Robert Prechter contends and that we are now in a deflationary cycle. The FED is fighting deflation with all the weapons in its arsenal but will it run out of bullets? It has already created trillions and the inflation rate is still under 2%. Can it really continue printing forever? The answer is probably not.
Note: Looking strictly at the cycles we see that we had 15 years down, 15 years up, 15 years down. Then the cycle changed to 18 years up and 18 years down. This is a big if, but "IF" the cycle is naturally a 15 year cycle, it is currently 6 years out of whack. Three years on each of those last two cycles. So is it possible that in order to get back in sync it lost 6 years and ended in 2008? I don't know.
Can the FED really Print Money Forever?
The only way the FED can continue to print is if the world continues to extend the U.S. credit. And why does the world continue to extend the U.S. credit? It certainly isn't because of the high interest rates T-bills are paying.
The main reason countries hold dollars is because Oil is denominated in dollars world-wide and so everyone needs dollars to buy oil. Those dollars never come back to the United States and so we can export our inflation to other countries. Which could be why inflation has remained below 5% since 1982. But what happens if the rest of the world decides to cut out the middle-man? China is in the process of working out deals with a variety of oil producing countries like Iraq, Venezuela and Argentina to trade directly oil for Chinese goods, without using dollars.If that happens demand for dollars will fall and the chickens could come home to roost, vastly exploding our money supply and shooting our inflation rate up to the double digits once again.
On the other hand if Robert Prechter is right, and demand dries up for dollars the only way to encourage other nations to hold our debt is to raise interest rates. Since the interest rate is the cost of renting money, basic supply and demand tells us that if the government wants to rent more money (borrow it) they have to increase the price they are willing to pay. But high interest rates will kill our economy which could drive inflation rates back to crash levels or below. So that could that could be the factor that causes the government to run out of monetary bullets.
See Robert Prechter's: Why Quantitative Easing Has NOT Brought Back Inflation
Download Your Free 90-Page Deflation eBook from Robert Prechter Here.
- What is Deflation?
- What is Disinflation?
- What is Agflation?
- What is Stagflation?
- What is Hyperinflation?
- What is Quantitative Easing?
- Why Inflation is U.S. Hottest Export
- What are “Foreign Exchange Reserves”?
- Why Money Printing Makes You Poorer
See the current MIP to find out what we are predicting for next month or next year. Remember our projections are based upon sound mathematical formulas not on simply extending the current trend forever.
About Tim McMahon
My grandfather lived through the Hyperinflation in Weimar, Germany--to say he was an original “gold bug” would be an understatement. I began reading his “hard money” newsletters at the age of 16 and the dividends from gold stocks helped put me through college. I began publishing the Financial Trend Forecaster paper newsletter in 1995 upon the death of James Moore editor of Your Window into the Future and the creator of the Moore Inflation Predictor©. FTF specializes in trends in the stock market, gold, inflation and bonds. In January of 2003, I began publishing InflationData.com to specialize in all forms of information about the nature of Inflation. In 2009, we added Elliott Wave University to help teach you the principles of Elliott Wave analysis. In January 2013, we began publishing OptioMoney. Connect with Tim on Google+
Use our custom search to find more articles like this

Share Your Thoughts