Because inflation decreases the value of of money, in order to have a “yard stick” of constant value it is necessary to use the inflation adjusted price when we consider the price of a commodity like Oil. Here at InflationData we have provided a variety of charts of the inflation adjusted price of commodities like Oil, Gasoline, Electricity, Natural Gas, Stock Market, Housing Prices, Education Costs and much more.
But each of these requires you to rely on potentially flawed inflation statistics generated by some outside agency or government. If that agency has an agenda other than accuracy your cost estimates could be flawed. But there is an alternative and that is to compare your selected commodity to another commodity. Often the commodity of choice is gold because of its monetary history. When gold was money this was easy and actually was done without thinking. Because the price of a dollar was pegged to a specific quantity of gold there really was no difference between saying the price denominated in Dollars or denominated in Gold.
But since gold was demonetized (lost its place as circulating money) its price has fluctuated in dollars and so looking at something like the price of oil compared to the price of gold can be quite useful in determining whether something is under or over-priced.
Gold vs Oil
Let’s look at gold vs. oil. This can be thought of in a couple of ways. The first is how much gold will it cost to buy a barrel of oil? Since historically gold was money this is a fairly logical approach. And recently as we mentioned in several articles on the Petrodollar several countries including Russia, China and Iraq have been working on deals to price oil in ounces of gold. In the chart below we can see that it only takes a fraction of an ounce of gold to buy one barrel of oil. The average price of a barrel of oil since 1946 is 0.07288 ounces of gold.
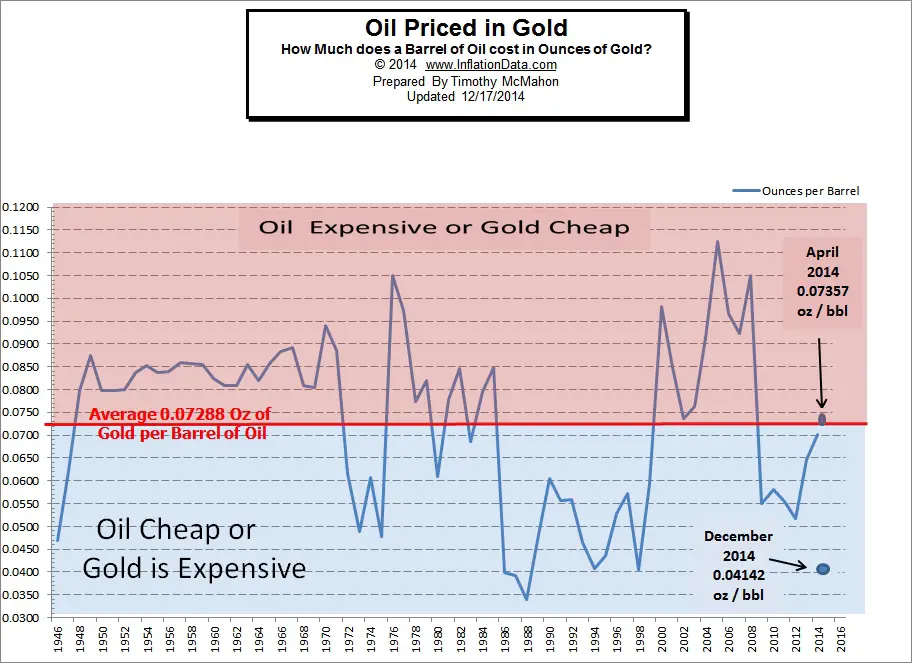
Understanding fractions of an ounce of gold takes a bit of thought. The formula for ounces per barrel is ounces divided by barrels but if you think of 1 ounce of gold as equal to 100 or sort of like $1 then 1/10th of an ounce of gold would be like a “Gold Dime” and 0.07 would be like 7 cents or 7% of an ounce. Normally we use a similar formula when we say Dollars per barrel.
If we look at the chart above we will see that for most of the time from 1948 through 1968 when the price of gold was fixed at $35/oz the price of oil was fairly stable between 0.08 and 0.09 ounces of gold. But once the price of gold started to fluctuate there were large swings between gold and oil.
We can see that at the low in 1988 it would take less than 0.035 ounces (roughly 1/3rd of a tenth-ounce) of gold to buy a barrel of oil. But at its peak in 1977 and again in 2008 it would take more than 0.10 ounces to buy a barrel of oil. So it was roughly three times as expensive. The interesting thing is that unlike buying oil with money… because both commodities are fluctuating (and not always in tandem) looking at the price of oil in gold you are not quite sure which one is out of whack. For instance in the early 1970’s we see that the price is around 0.05 ounces per barrel. At that point was Oil cheap or gold expensive?
From January 1970 until December 1974 oil went from $3.60/barrel to $11.20/barrel which is more than triple the price so most people thought that oil was getting very expensive. Tripling in price in such a short period of time what’s up with that?
But during the same period gold went from $34.94 to $183.85 or an increase of 5.26 times so it was gold that increased more and was probably overpriced. But we have to look at what caused it? During that period the U.S. dollar had lost all respect in the world and many people around the world thought that the dollar would be inflated out of existence. No one trusted the dollar and so it depreciated in value, therefore it took more of them to convince someone to give you their oil (or gold for that matter).
Barrels Per Ounce
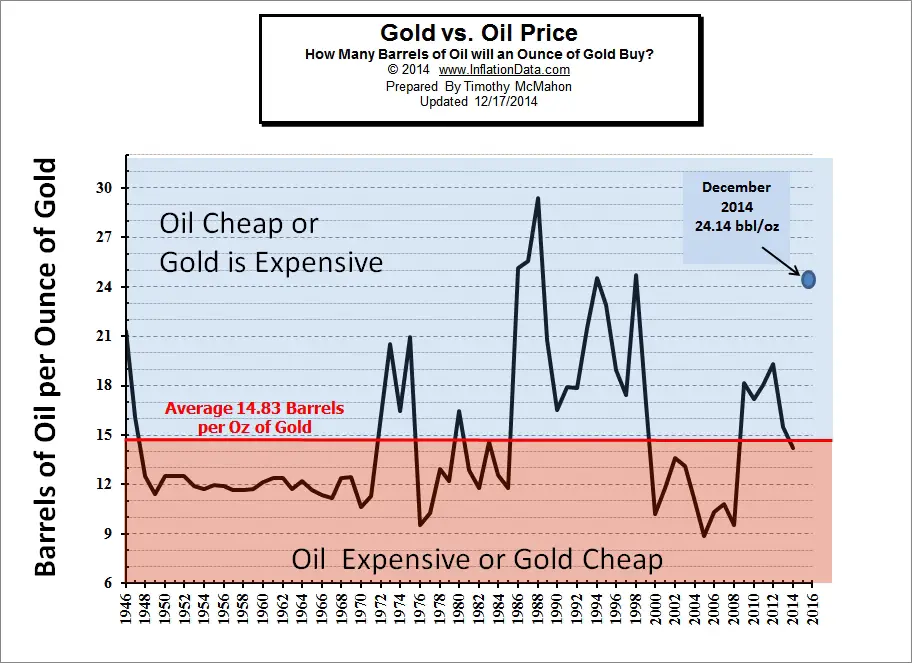
Since both are commodities however, we can just as easily flip the equation upside down and look at barrels per ounce of gold.
 Click for larger image
I personally prefer to look at the chart this way because we are dealing with whole numbers rather than fractions. This way we have one ounce of gold and we are looking at how many barrels of oil we can buy. The average since 1946 is that one ounce of gold would buy 14.83 barrels. But when oil is expensive or gold is cheap you might only get 9 barrels for your ounce of gold and when oil is cheap like it is in December 2014 you can get 24.14 barrels for your ounce of gold.
You might be wondering why there is such a big gap between the black line and the December dot. That is because the black line is the annual average price while the dot is the price on December 17th 2014. The price of oil has fallen from $97 in June to $49.50 on December 17th . During that same period gold hovered between $1300 and $1200. So it would appear that oil is cheap compared to gold.
For more on this subject see:
You might also like:


Great Tim Sir, I got so much clarification crude vs gold. It was really very amazing article to understand the relation of both.
Earlier I thought that crude oil is more expensive than gold but after reading this article and chart graphs got so much clarification.
I think its good time to invest in gold because crude futures increasing due to production cuts by API and OPEC.
Thanks once again..