
For thousands of years gold has been synonymous with money, albeit with periods where governments mandated other mediums of exchange. Therefore, throughout history prices were measured in gold rather than in dollars, Rubles or Yen.
By looking at the chart to the right you can see the current price of gold over the last 24 hours in terms of dollars. ![[Gold Price Quote from www.kitco.com]](http://www.kitconet.com/charts/metals/gold/t24_au_en_usoz_2.gif) As of this writing it is $1256.70 per troy ounce but gold has fallen from its monetary pedestal and now fluctuates just as other commodities.
As of this writing it is $1256.70 per troy ounce but gold has fallen from its monetary pedestal and now fluctuates just as other commodities.
The Fall of Gold and Rise of the Dollar
Shortly after assuming office in 1933, President Franklin Roosevelt perpetrated one of the greatest frauds ever on the American public. He knew that the government had inflated the currency and the U.S. could no longer maintain the pretense that Gold was still worth only $20.67 per ounce. So he hatched a scheme to nationalize all the gold in the country, by forcing the citizens to turn in their gold at the official price. Once he collected it all, he readjusted its price to the then market price of $35/oz. Thus he presided over a 69.33% gain in the value of the gold equivalent to a 69% tax on the ownership of gold. Not just on the gain in value but on the total value of all the gold. In those days, a government’s money supply consisted of the number of ounces of gold it held.
 So Roosevelt’s gold grab effectively, increased the money supply and “legitimized” the inflation that had silently been occurring behind the scenes as prices increased but gold values did not. In the years from 1913 through 193o inflation had increased 68.69% so the increase in the price of gold was simply making up for all the hidden inflation. Although by 1933 there had been several years of deflation knocking the gain down to “only” 31.3% so the government was able to pocket the difference. In hindsight, this increase in the money supply may have been a factor in the emergence from the Depression. If nothing else it certainly bolstered the government’s coffers.
Roosevelt’s 2nd Gold Trick
In 1944, shortly before leaving office, Roosevelt pulled another fast one regarding gold. Gold was no longer the medium of measurement for the people but still was used as the medium of exchange between governments, the source for the term “gold standard” if you will.
Roosevelt’s first gold grab worked so well that he decided to pull a similar scam on all the other governments this time. At the tail end of WWII, he got 44 allied countries together in Bretton Woods, New Hampshire and squeezed out an agreement that the U.S. dollar would become the new standard. Making the U.S. dollar “as good as gold” was not an easy sell, both France and Brittan bitterly objected, but Roosevelt did some arm twisting enabling the dollar to gain that stature due to its backing by gold (and the fact that the U.S. had a lot of clout because the rest of the signatories to the agreement owed the U.S a lot of money due to the war at the time.)
Nixon’s Gold Trick
Over the next 27 years the U.S. maintained the official gold price but quietly in the background inflated its currency until everyone knew that the dollar wasn’t worth $35/oz. But due to the inflation of the dollar, by 1971 the United States could no longer continue the fiction that it had enough gold to maintain the (by then) artificially low price set in 1944. France had called our bluff and decided to buy as much gold as they could at the discounted price, so Nixon was forced to unilaterally cancel the convertibility of dollars to gold at a fixed rate and so the price of gold began to float against the dollar, thus reneging on the deal Roosevelt had made.
Once the price was allowed to float the government began selling “excess reserves” in an attempt to curb inflation and balance the budget.
The Dawn of Petrodollars
The lack of convertibility to gold and high inflation rates resulted in a lack of trust and a declining demand for U.S. dollars on the world market and a falling exchange rate. In an effort to shore up demand for the dollar, in 1973 Nixon struck a deal with Saudi Arabia that they would denominate all oil sales in dollars and in exchange the U.S. would supply weapons and protection to the Saudis. This system of requiring oil sales to be performed in dollars increased the demand for dollars (since everyone needs oil) and became known as the “Petrodollar”. These petrodollars not only increased demand for the U.S dollar but also allowed the U.S. to export its inflation as these dollars never return to the U.S. but instead are used strictly for foreign trade.
By 1975, all of OPEC had agreed to denominate all oil sales in Dollars in exchange for weapons and military assistance.
So through a combination of Roosevelt’s Bretton Woods agreement and Nixon’s petrodollar scheme the U.S. dollar has been the standard for 70 years now.
The Twilight of the Petrodollar
In the years since 1975 the dollar has suffered 340% inflation and consequently many of the oil producing nations felt cheated having to accept a depreciating asset like the dollar for their valuable oil. Especially disgruntled were those who were not on the receiving end of the arms deals like North Korea, Iran, Venezuela and Syria all of which have tried or are moving away from the petrodollar. Some people believe that the real reason for the war in Iraq was because they threatened to stop using the dollar and so they were made an example for the other oil producing countries.
 However, it was only a temporary deterrent. Other countries that would not be politically expedient to attack like the BRIC countries i.e. Brazil, Russia, India and China have begun negotiating oil deals in their own currencies rather than the U.S. dollar.
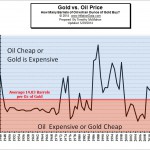
See Oil vs Gold for more information and a comparison of the ratio between the price of oil and the price of gold.
Image courtesy of Digitalart / freedigitalphotos.net

Leave a Reply