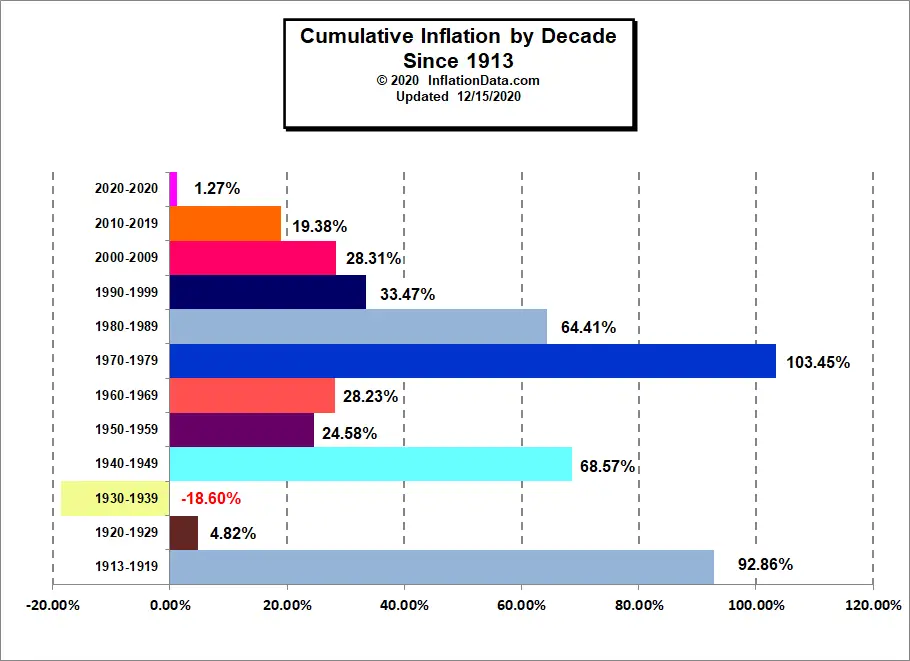
This Chart shows the cumulative Inflation Rate by decade. Each bar represents the total inflation from January 1st on the year ending in a zero and ending on December 31st on the year ending with a 9. For instance from January 1920 through December 1929. The one exception is the teen years since they only started tracking inflation in 1913. Note: To calculate this you must use December 1919 through December 1929 data since the Consumer Price index is set as of the last day of the month.
The two worst decades for inflation were the teens which racked up almost 100% inflation (prices almost doubled) in the seven years that were tracked. The other really bad decade was the 1970's which accumulated slightly over 100% inflation in ten years. The 1940's and the 1980's were also bad with over 60% inflation each.
On the other hand, the 1930's had deflation for the decade as prices actually ended lower during the decade than they started. Note: There was so much inflation in January 1920 that if you calculate the average from the end of January 1920 - December 1929 the average for the decade is -0.09% but if you calculate it correctly from the end of December 1919- December 1929 that single month increases the average to 0.38% for the decade.
So What caused Prices to Decline During the 1920's?
Falling prices are understandable because of the massive depression in the 1930's but the decline may be a bit surprising for the "Roaring" 1920's. So what happened?
World War I began in 1914 and ended in 1918 and prompted the government to expand the money supply to finance the war. After the war ended, the economy contracted to absorb the excesses of the previous decade, thus resulting in the deflation of the 1920's. Interestingly, the year 1920 was more like the teens since 1920 actually had 15.72% inflation in a single year. But the rest of the decade erased that and more.
Deflation began a year later as prices deflated by -10.94% in 1921 and by another -6.13% in 1922. Prices stabilized and were relatively level for the middle of the decade but then fell -1.93% in 1927 and another -1.15% in 1928. The Consumer Price Index (CPI-U) began January 1920 at 19.3 and ended December 1929 at 17.2
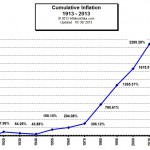
For more information, you may also be interested in the average inflation rate for each decade and also the Cumulative Inflation since 1913.
Subscribe to our FREE monthly E-zine and we will keep you up-to-date on what is happening in the area of inflation, interest rates and market trends.
Webmasters if you would like to use any of our charts please check our usage policy.
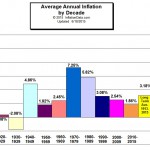
It is interesting to note that the inflation for the "teens" decade was the highest at 8.70% and the 70's were close on their heels at 7.09% while the 20's have virtually Zero inflation.
The decade of the 30's showed negative inflation or true deflation where prices actually declined on an annual basis. It isn't hard to figure out that prices were falling during the depression (the 30's).
Note that the most prosperous decades were those of low inflation like the roaring twenties, the fabulous fifties, and the nineties. Both the 20s and the 90s culminated in a stock market crash while the decade with deflation is known for the poverty they included. Interestingly, deflation doesn't always equal depression. A truly healthy economy with increasing productivity and no increase in money supply will result in lower consumer prices and even more wealth to go around.
Click Here for information on Gasoline Price Inflation
See Also:
 |
 |
| Average Annual Inflation by Decade | Total Cumulative Inflation |
- Inflation and Consumer Price Index- Decade Commentary
- Inflation and CPI 1913-1919
- Inflation and CPI 1920-1929
- Inflation and CPI 1930-1939
- Inflation and CPI 1940-1949
- Inflation and CPI 1950-1959
- Inflation and CPI 1960-1969
- Inflation and CPI 1970-1979
- Inflation and CPI 1980-1989
 Connect
with Tim on
Connect
with Tim on
Use our custom search to find more articles like this

Share Your Thoughts