
 June 10, 2022
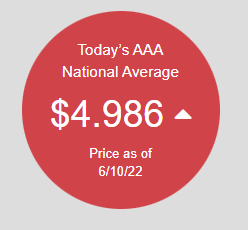
Update: AAA says the national average is now almost $5.00 a gallon (and much higher in places like California). That moves the blue dot on the chart below up and prices are now well above inflation-adjusted peaks!
June 2, 2022
It’s no secret that gasoline prices are skyrocketing. However, a couple of months ago we said that although gas prices were high and rising, they still weren’t at record levels when looked at in inflation-adjusted terms.
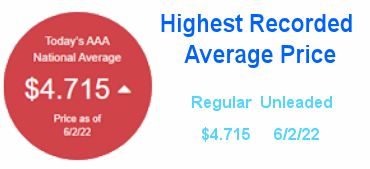
But all that has changed now as gasoline prices continue to climb upward. Today the AAA reported the highest national gas prices they have recorded.
Although this is a significant development, all sorts of prices are making new highs all the time simply due to overall inflation. But, gas prices are different. Although we tend to think that they are always going up that isn’t true. Gas prices have been in a relative downtrend for almost a decade.
The nationwide average annual price of Regular Gasoline peaked at $3.55 way back in 2012 and steadily fell from there. The inflation adjusted price in April 2022 dollars would have been $4.47. So until gasoline prices climbed above $4.47 we may have had the nominal highest prices but in terms of purchasing power there were worse periods.
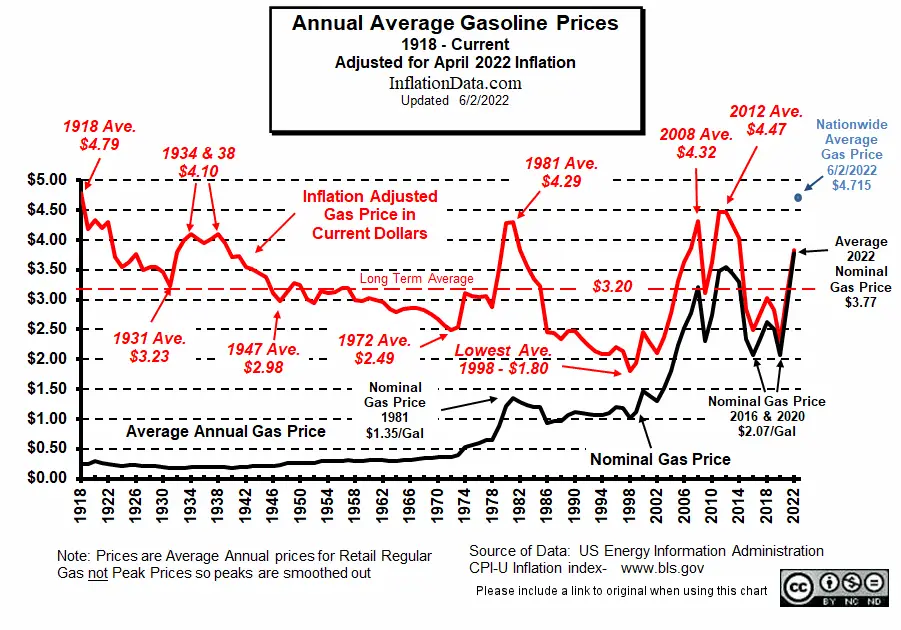 Looking at the above chart we can see the relationship between the nominal price (i.e. the price you would have actually paid at the pump) and the inflation adjusted price (i.e. the equivalent price in 2022 dollars). However, sharp eyed people will notice that the current annual average hasn’t exceeded the 2012 annual average. But the June 2, 2022 price is higher than the inflation adjusted 2012 annual average gasoline price.
If the current spike is short lived it is still possible that the annual average for 2022 will end up lower than 2012’s annual average but only time will tell.
But What about Peak Prices?
The peak in 2012 occurred during the week of April 9th 2012, at $3.877. Current prices are certainly above $3.877. The annual average price is almost that high. But to get a true picture we have to look at the inflation adjusted price of gas back then. In April of 2012 the CPI index was 230.085 and it is currently 289.109 so overall prices were 79.6% of what they are today or 20.4% lower. So if we adjust the $3.877 price of gas up by 20.4% due to inflation, we get a price of $4.87 as a peak for the 2012 year. So, although at $4.715 we are close to the inflation adjusted peak we aren’t quite there yet. Although, a month ago gas prices were “only” $4.19 so if we get another month like this one we will certainly be above the inflation adjusted peak of 2012.
Also, the peak was fairly short lived in 2012 and by the end of the year prices were back down to $3.254 so even if prices don’t exceed the peak if they stay at current levels the annual average could still be higher than in 2012.
Historical Gas Prices:
Can you guess what year this was?
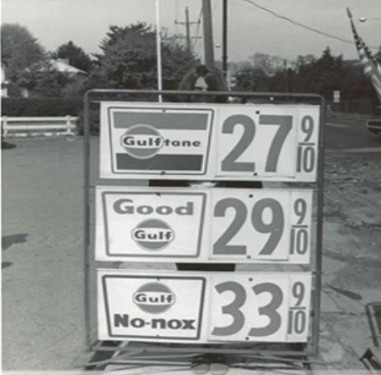
The last time regular gasoline averaged $0.27 for the entire year was 1951 but it was in the low .30s during the early 1960s and there were could have been some brief periods where you might see a sign like this.
Can you guess what year this was? This one might be a little easier based on the girl’s clothes…
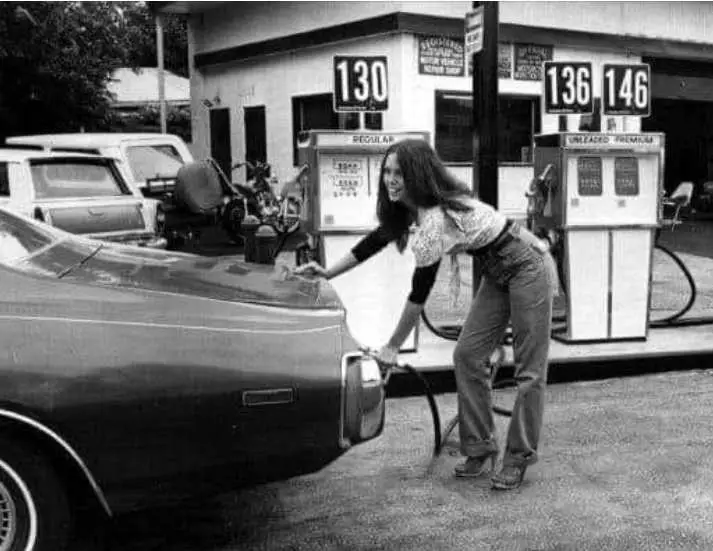
In 1979 gas averaged $0.88 a gallon, so 1980 was the first year that it climbed over a dollar a gallon. It averaged $1.22 in 1980 so it could have been $1.30 in some places. By 1981 gasoline prices averaged $1.35 for the year so it was most likely taken in 1981.
We’ve updated the inflation adjusted price of gasoline page.
Data Sources:
You might also like:
- Annual Inflation Chart
- Gasoline vs. Crude Oil Prices
- Historical Gas Price Chart
- Current Average Cost of Gas by County
- Gasoline Taxes by State
- Average Cost of Gas Per Month
- Calculating Miles Per Gallon
- Regarding Gas Inflation
- Historical Oil Prices Chart
- More Inflation Adjusted Prices
- Crude Oil and Gold
- Oil, Petrodollars and Gold

I am sorry. I can follow along with your line of thinking and what you write is agreeable, but have some difficulty thinking easily about the topic. In 1918, the high inflation-adjusted gasoline price was $4.79 according to the chart you updated on the inflation page. Above, the 2012 peak adjusted-inflation price was $4.87. So, today’s gasoline price in my area is $4.79. Does that mean the price of gasoline is the same now as in 1918, but eight cents lower than 2012? Are you saying 2012 was the highest priced year for gasoline when inflation-adjustments are made? Additionally, is your CPI calculation the same as the CPI calculator used pre-1990s? The Fed changes to the CPI in the 1990s no longer factor the Housing Price the same as the pre-1990s CPI, which some argue makes it difficult, or impossible, to to compare the current CPI (post-1990s) with the pre-1990’s CPI’s. What do you think?
Thanks!
Yes, in inflation adjusted terms 2012 was the highest but only marginally. Remember that was in the wake of one of the largest recessions, so prices should have come down not gone up. As far as the changes in the CPI go, they readjusted the base year in 1984 to reset it to 100 but that didn’t change the calculations. The housing index changes may have some effect see https://inflationdata.com/articles/2022/04/02/does-the-cpi-exclude-mortgages-or-rent/ for more info. It also is interesting that when thinking back, the gas prices of the 1970s and 80s stand out more in my mind than 2012. Perhaps, because everything was so terrible after 2008, the housing crisis and stock market took center stage so gas was only one of many issues.
Thank you for a helpful response!
I have to change the price of gasoline in my area. It was $4.79 but has now changed this afternoon in some places to $4.99. I live in Western PA. So, at $4.99 in my area gasoline had now surpassed the highest price on record, if I understand you. Am I correct?
That price is a big jump for us, because for weeks it hovered roughly around $4.65, the $4.79 price happened some time earlier this week, and now jumped another twenty cents since this morning to $4.99. So, a 30 cent jump this week.
Your blog is very informative! I have started to browse some other articles and will read what you linked me, thanks again!