Over the years we've published a variety of articles on the inherent "tug-of-war" between inflationary and deflationary forces in the world including How can we have Inflation and Deflation at the same time? and Battle of the 'Flations both from back in 2008 and Deflation or Inflation - Which is it? in 2009 and Which is Stronger- Inflation or Deflation? in 2010. Another recurring theme has been Velocity of Money and Money Multiplier- Why Deflation is Possible and today John Mauldin will take a stab at each these critical topics once again. Understanding their interrelationships will greatly help you understand the monetary forces at work.~ Tim McMahon, editor The Flat Debt Society By … [Read more...]
More Quantitative Easing in the Cards?
For some time we've been saying that the FED is addicted to Quantitative Easing (QE) and that it wouldn't be so easy to kick the habit. Then last week we told you that there are signs that the Deflationary roots go deep and the only thing keeping the economy on a steady keel is all the money being created by the FED. But all that funny money is eroding the foundations and the FED can't keep it up forever. Up until now every crisis required a bigger and bigger entity to step up to the plate and assume the debt. At this point the only entity bigger than the FED left to step up is the World Bank. So when the FED runs out of bullets it will be the last round of musical chairs. But at this … [Read more...]
Europe is Teetering on the Edge of “Japan-Style” Deflation
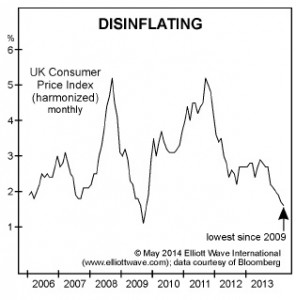
Europe: The ONE Economic Comparison That Must Not Be Named... Was Just Named The Continent is now teetering on the edge of a "Japan-style" deflation. Here's our take on it. By Elliott Wave International It's happened. The one economic comparison Europe has dreaded more than any other; the name that's akin to Lord Voldemort for investors has been uttered: "deflation." And it's not just "deflation." You can still spin that term in a positive light if you get creative enough. Say, for example, "Falling prices during deflation actually encourage consumers to spend." But once you add the following two very distinct words, there's no way to turn that frown upside down. And those words … [Read more...]
Where is Gold Headed?
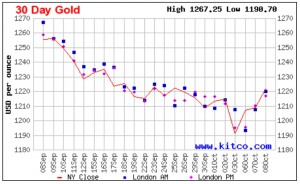
This week has been tumultuous for the markets with steep market drops and subsequent rallies. Over the last month gold has been as high as $1260 subsequently it fell steadily to $1190 for a 5.5% drop. But then gold bottomed near $1190 and as of this writing it has risen above $1220 for a 2.5% rally in a couple of days. So what does that mean for the price of gold? Is it doomed or is the bottom in and we are seeing bargain prices? This week two of our favorite commentators Casey Research and Elliott Wave International have both jumped into the discussion and I present their views here. ~ Tim McMahon, Editor Gold: Time to Prepare for Big Gains? By Casey Research Years of … [Read more...]
Inflation Falls 3rd Straight Month
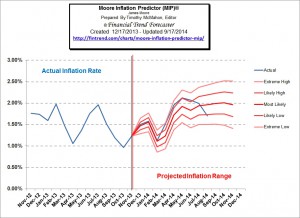
The Bureau of Labor Statistics (BLS) released the August inflation numbers today and for the third straight month inflation is lower. The annual inflation rate for the 12 months ending in May was 2.13%. The June inflation numbers were 2.07%. In July inflation fell to 1.99% and in August it was down to 1.70%. As the inflation rate falls this is "disinflation" on an annual basis although July and August were "deflationary" on a monthly basis, i.e. each monthly number was below zero at -0.04% and -0.17% respectively. Our Moore Inflation Predictor (MIP) is generally quite accurate. Last month the MIP forecast a slight decrease in inflation for August but we actually got a bit larger 14.5% … [Read more...]
Where is Gold Headed?
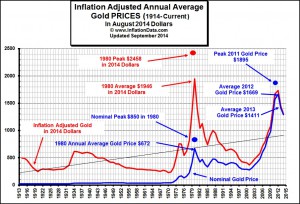
To get the true measure of anything it is important that you use a standardized measurement. This of course is why a "foot" or "inch" eventually became exactly a certain length and didn't vary based on each particular person doing the measuring. And more recently it is why Celsius measurement relates to the exact freezing and boiling points of water at an exact atmospheric pressure. It is also why, when we measure a commodity like Gold or the stock market we need to use a scale that doesn't change. Unfortunately, the typical measurement i.e. the U.S. dollar is always changing in value. That is the dollar depreciates due to inflation thus changing the measurement on a daily (or at least … [Read more...]
Economy vs. Fed Rate Hikes
Confusion Continues The bad news is markets tend to get jittery when the Fed is preparing for a new interest rate cycle. The good news is the primary reason the Fed is contemplating raising interest rates is a strengthening U.S. economy. The question in the short run is: Will the economy be strong enough to offset the negative impact of higher rates? The odds of the answer being “yes” increased Thursday. From Reuters: Gross domestic product expanded at a 4.2 percent annual rate instead of the previously reported 4.0 percent pace, the Commerce Department said on Thursday. Both business spending and exports were revised higher, while a buildup in business inventories was smaller than … [Read more...]
Gasoline Taxes by State
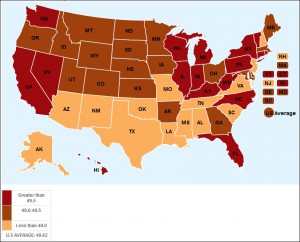
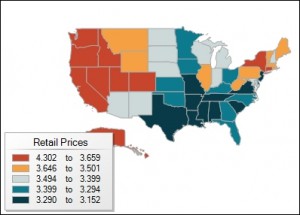
Yesterday we looked at the BLS' release of the July Inflation numbers and that lead to a discussion of gasoline prices and the correlation between high gas prices and politics. The first thing we looked at was the graphic of gasoline prices by state. And then we looked at the political landscape based on the percentage of the state that voted Democrat or Republican. We looked at the following graphic and noted that "the more blue the more Democrat and the more red the more Republican (which by the way is backwards compared to the rest of the world) and incidentally almost exactly backwards for the gasoline chart as well. There appears to be a very high correlation between high gas … [Read more...]
BLS Releases July Inflation Numbers
The U.S. Bureau of Labor Statistics released their inflation numbers for July on August 19th. The basic summary they emailed read as follows: CPI for all items rises 0.1% in July as food prices rise but energy prices decline 08/19/2014 On a seasonally adjusted basis, the Consumer Price Index for All Urban Consumers increased 0.1 percent in July after rising 0.3 percent in June. The index for all items less food and energy rose 0.1 percent in July, the same increase as in June. If you just read that what impression would you get? Maybe that inflation is UP? At least that is what the headline implies. But then it says, energy prices are down. And it also implies … [Read more...]
Inflation Flat in June 2014
The Bureau of Labor Statistics released their Consumer Price Index (CPI) for June of 2014 on July 22nd. Based on the rounded numbers this would result in an Annual Inflation Rate of 2.1% the same as last month (May). But here at Inflation Data we look at it to two decimal places and based on that we can see that in May the rate was actually 2.13% and in June it fell ever-so-slightly to 2.07%. Many will say that it isn't statistically significant and it quite possibly isn't but it is quite possible that inflation is heading down again. Time will tell. I find it interesting that both the WSJ and Reuters top articles on inflation today say inflation is "Up" WSJ:Spike in Gas Costs Pushes Up … [Read more...]


