
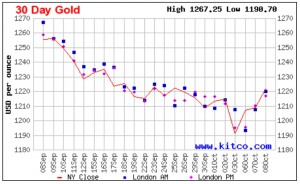
This week has been tumultuous for the markets with steep market drops and subsequent rallies. Over the last month gold has been as high as $1260 subsequently it fell steadily to $1190 for a 5.5% drop. But then gold bottomed near $1190 and as of this writing it has risen above $1220 for a 2.5% rally in a couple of days. So what does that mean for the price of gold? Is it doomed or is the bottom in and we are seeing bargain prices?
This week two of our favorite commentators Casey Research and Elliott Wave International have both jumped into the discussion and I present their views here. ~ Tim McMahon, Editor
Gold: Time to Prepare for Big Gains?
Click for Larger Image
By Casey Research
Years of a severe downturn in the gold market have left very few bulls to speak out in favor of the yellow metal. Here are some positive opinions on the future of the precious metal, from the recently concluded Casey Research Fall Summit.
David Tice, founder of the Prudent Bear Fund, believes we are heading for a “global currency reset” that will reduce the role of the dollar in global trade. Central banks, he says, don’t possess all the gold they claim to, and the unwinding of the paper gold market probably isn’t far down the road—it could even ignite the next major crisis.
The paper gold market (for example, exchange-traded funds like GLD) has massive leverage, with a ratio of 90:1 or 100:1 of paper claims on gold bullion. If only a small fraction of owners convert their paper to physical gold, says Tice, it will create a “no bid” price environment and cause the price of gold to explode.
He believes that once the paper gold market collapses, gold will be priced on the basis of supply/demand for the physical metal—which means it could be headed for $3,000 to $8,000 per ounce.
Ed Steer, editor of Casey Research’s popular e-letter Gold and Silver Daily, is equally bullish on gold… in the long term, because right now, he believes the gold market to be rigged: “Central banks intervene; that’s what they do.”
They control not only gold, but also silver, platinum, palladium, copper, and oil. He says there are two possible reasons that Germany hasn’t gotten its gold back that it had stored in the US—either the gold doesn’t exist or there’s so much paper written against it that it can’t be moved for collateral reasons.
While there’s not much an investor can do about gold manipulation, Steer believes that the manipulators’ schemes will blow up in their faces sooner than later.
Summit regular Rick Rule, chairman of Sprott US Holdings, isn’t worried about the bear market in gold.
“What matters is your response to the bear market,” he says. “If you have the wits, courage, knowledge, and cash to take advantage of them, bear markets are great.”
He’s keeping his eyes peeled on junior gold mining stocks, which, he says, are hugely attractive right now.
“Our market has fallen by 75% in three years. That means it’s 75% more attractive than in 2010, when we were all in love with it. Within a few years, we’ll look back on today’s low prices as the good old days.”
Louis James, chief investment strategist of Casey’s Metals & Mining division, also welcomes the opportunities to buy low that the current slump in gold prices provides.
He personally owns stock of three of the junior miners present in the Map Room at the Casey Fall Summit. All three of them have exceptionally high-grade projects that are delivering what they promised.
To get all of Louis James’ stock picks (and those of the other speakers), as well as every single presentation of the Summit, order your 26+-hour Summit Audio Collection now. It’s available in CD and/or MP3 format. Learn more here.
The Gold Bug is Set to Bite Back
By Elliott Wave International
Since hitting a record high of $1921.50 per ounce in September 2011, gold prices have erased 30% in value. By the end of day on October 3, 2014, gold prices were circling the drain of a 15-month low.
After such devastation, the global community of gold analysts, advisers and investors finds itself scattered as an anthill colony after being stepped on by a giant bear paw. This recent Forbes article captures the divisiveness among gold watchers:
“‘Survey Participants Split Over Gold Price Direction‘ as a potential decline in the U.S. dollar competes against ‘geopolitical reasons’ for prices to bounce.”
This magnifies an important point, namely:
Mainstream financial analysis uses news events to gauge where prices may be headed. The problem with this strategy is that it does not anticipate trend changes — it only reacts to the changes that have already happened, almost always leaving you one step behind.
Naturally, this reliable unreliability leads to uncertainty among those invested in the market’s trend.
Elliott wave analysis takes a radically different approach. Rather than looking outside the market for clues into future price action, Elliotticians look to the price charts themselves. There, they identify fixed and finite patterns which shape the market’s near- and long-term character.
You can use gold’s 3-year-long sell-off as a prime example. Back in 2010-2011, gold’s bullish “fundamental” picture was allegedly in the bag. The U.S. Federal Reserve just launched its $1-trillion-a-year quantitative easing program, which was widely expected to fuel gold’s inflationary fire. An August 25, 2011 Gallup Poll confirmed:
“Americans Choose Gold as the Best Long-Term Investment.”
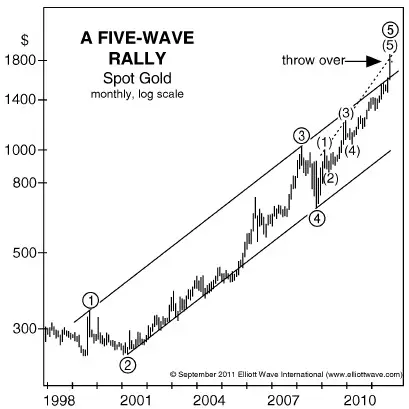
Elliott Wave International, however, saw a different outcome for gold on the metal’s price chart: an impending decline. In the September 2011 Elliott Wave Financial Forecast, our analysis included the following chart, which showed gold prices at or near the end of a decade-long, 5-wave advance.
“Gold’s wave structure is consistent with a terminating rise. [Elliott waves progress and therefore top out in 5 waves]. As this monthly chart shows, prices exceeded the upper line of the channel formed by the rally from the 1999 low in what Elliott terms a throw-over. A throw-over occurs at the end of a fifth wave, and represents a final burst of buying. The pattern is confirmed as complete once prices close back under the upper line, which currently crosses $1650.”
So, that was then. What about now?
Today, the mainstream is divided between opposing fundamental forces. But at the San Francisco Money Show in August 2014, Elliott Wave International’s chief market analyst Steve Hochberg identified a very compelling reason to form a united front in gold’s future — an Elliott wave triangle pattern.
You can hear the exact point when Steve shared this exciting development to his audience via this clip from his Money Show presentation:
Steve goes on to explain how pinpointing this triangle helps him lay down a forecast for “what gold is going to do from here on out.”
Would you believe that gold prices should “rally” for a year, maybe even two??
Would you also believe you can watch Steve’s entire Money Show presentation on gold (not just the 30-second preview featured here!), FREE?
Well, you absolutely can. For a limited time only, Elliott Wave International is releasing Steve’s Money Show presentation on gold — in two 5-minute long videos.
This very special offer is FREE to all Club EWI members. Simply complete your free Club EWI profile and get instant access to Steve’s presentation >>
This article was syndicated by Elliott Wave International and was originally published under the headline The Gold Bug is Set to Bite Back. EWI is the world’s largest market forecasting firm. Its staff of full-time analysts led by Chartered Market Technician Robert Prechter provides 24-hour-a-day market analysis to institutional and private investors around the world.

Leave a Reply