Europe: The ONE Economic Comparison That Must Not Be Named… Was Just Named
The Continent is now teetering on the edge of a “Japan-style” deflation. Here’s our take on it.
By Elliott Wave International
It’s happened. The one economic comparison Europe has dreaded more than any other; the name that’s akin to Lord Voldemort for investors has been uttered: “deflation.”
And it’s not just “deflation.” You can still spin that term in a positive light if you get creative enough. Say, for example,
“Falling prices during deflation actually encourage consumers to spend.”
But once you add the following two very distinct words, there’s no way to turn that frown upside down. And those words are “Japan-style” deflation.
“Japan has languished in a deflationary cycle pretty much since the late 1990s, its once booming economy reduced to ‘lost decades’ of stagnation. Europe is now teetering on the edge.” (Sept. 19, Associated Press)
Which begs an obvious question: Weren’t Europe’s central banks supposed to prevent this very scenario from happening via their unprecedented, 4-year-long campaign of “money-printing,” bond-buying and interest-rate-slashing?
The answer to that question is… yes. Those actions were indeed supposed to boost inflation.
What’s more, no one can say the European Central Bank didn’t utilize every available tool in their arsenal to try and accomplish that end. The problem is they were fighting a losing battle.
And, we are both happy and sad at the same time to report that from the very beginning, when the first rate cut was loaded into the save-the-economy cannon, we at Elliott Wave International foresaw that Europe’s retreat toward deflation was unavoidable.
Here’s a quick recap of what led us to that conclusion.
— 2011 —
January 2011: The “D” word is way off the mainstream radar. Soaring oil, grain, and commodity prices has fueled widespread fears of runaway inflation. Writes one January 22, 2011 LA Times article:
“Around the world, many countries aren’t confronted with the debilitating forces of deflation, but the opposite — inflation. Annualized inflation in the euro zone rose above the 2% target rate for the first time in more than 2 years.”
February 2011: The European Central Bank unveils its brand-new Long Term Refinancing Operations (LTRO), extending nearly half a trillion euros in 3-year loans to banks at negligible interest rates — to stimulate the economy (and inflation).
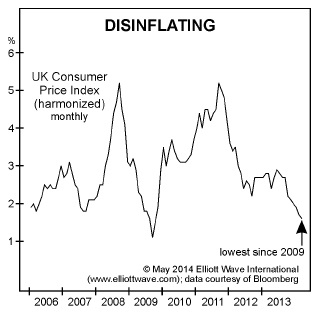
July 2011: U.K.’s consumer price index declines, prompting a sigh of relief, not a shudder of fear from the Bank of England, who says “we can now breathe a little easier.”
(VS.)
Our August 2011 European Financial Forecast:
“We maintain our stance, however, that the looming threat is not inflation but deflation. Far from a sense of relief, the Banks’ paramount feelings should soon develop into an unrelenting dread.”
September 2011: U.K.’s consumer price index peaks at 5.2% and officially sets the downtrend in motion.
— 2012 —
January 2012: The Bank of England adds another 50 billion pounds to its asset purchase program, bringing its 3-year campaign of “money-printing” to 325 billion. The European Central Bank is less than 14 years old, yet total assets at the ECB breach 3 trillion.
February/March 2012: U.K. producer price inflation comes in higher than expected, prompting one U.K. economist to say: “PPI: Another wake-up call for apoplithorismosphobes,” the clinical term for those who fear deflation. The economist goes on to recommend that sufferers “seek therapy.” (March 12 Wall Street Journal)
(VS.)
Our July 2012 European Financial Forecast:
“Our models say that inflation rates will keep failing until they’re again measuring the rate of deflation as they last did briefly in 2009.”
August 2012 European Financial Forecast makes the first comparison of Europe to Japan:
“European leaders,” by slashing rates and printing money “seem determined to replicate Japan’s experience. Their efforts will not stop consumer price deflation.”
— 2014 —
May 2014 European Financial Forecast:
“The chart shows that British CPI accelerated lower after falling from a counter-trend peak of 5.2% back in September 2011, with year-over-year price growth just ticks above its late-2009 low.
“More than half of the 28 EU nations either teeter on the brink of deflation or have succumbed to falling prices already.
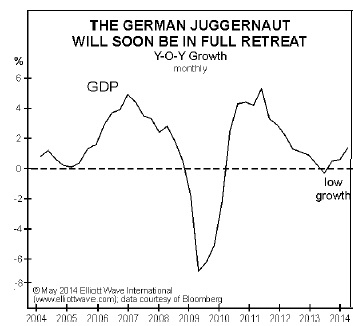
“The following chart shows that economic stagnation has reached even Germany, Europe’s most robust economy.”
September 2014 European Financial Forecast:
“In a related phenomenon, the press has now jumped on the slew of similarities between Europe’s flagging economy and Japan’s… Clearly, the parallel paths of the two regions have become impossible for the press to ignore.
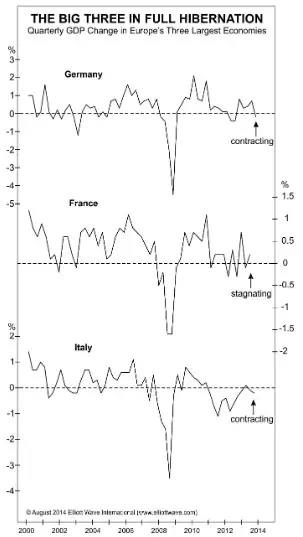
“The central bank’s latest deflation-fighting contrivance is a €400 billion package of targeted LTRO loans, which are designed to compel banks to lend to ordinary business owners. Also like Japan, the ECB has slashed its main refinancing rate to 0.15% and now charges for banks’ overnight deposits. The result? Shown below, Europe’s largest economy, Germany, just contracted 0.2%; French economic output has ground to a halt; and Italy just entered its third recession since 2008.
The world has finally woken up to the possibility of a Japan-style deflation in Europe — years after the writing was already on the wall.
Now, you need to prepare for what’s to come.
The best part is, Elliott Wave International’s Founder and President, Robert Prechter, has written a book that can help you do just that. And you can read 8 chapters of Prechter’s bestseller, Conquer the Crash, free.
 |
8 Chapters of Robert Prechter’s Conquer the Crash — FREE |
This free, 42-page report can help you prepare for your financial future. You’ll get valuable lessons on what to do with your pension plan, what to do if you run a business, how to handle calling in loans and paying off debt and so much more.
Get Your FREE 8-Lesson “Conquer the Crash Collection” HERE >>
This article was syndicated by Elliott Wave International and was originally published under the headline Europe: The ONE Economic Comparison That Must Not Be Named… Was Just Named. EWI is the world’s largest market forecasting firm. Its staff of full-time analysts led by Chartered Market Technician Robert Prechter provides 24-hour-a-day market analysis to institutional and private investors around the world.

Leave a Reply