
Yesterday we looked at the BLS’ release of the July Inflation numbers and that lead to a discussion of gasoline prices and the correlation between high gas prices and politics. The first thing we looked at was the graphic of gasoline prices by state.
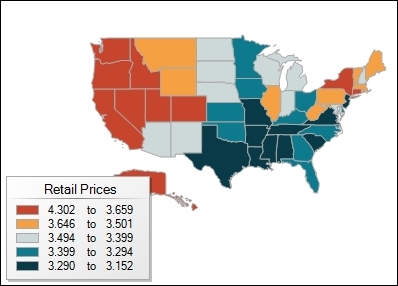
Aug 2014 Gasoline Prices
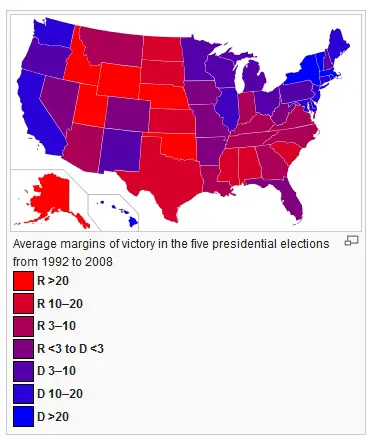
And then we looked at the political landscape based on the percentage of the state that voted Democrat or Republican. We looked at the following graphic and noted that “the more blue the more Democrat and the more red the more Republican (which by the way is backwards compared to the rest of the world) and incidentally almost exactly backwards for the gasoline chart as well. There appears to be a very high correlation between high gas prices and Democrat controlled states while Republican states tend to have lower gas prices. With a few exceptions like New Jersey, Minnesota, Utah and Idaho.
Gasoline Taxes by State
But several readers didn’t want the conclusion left up in the air… they preferred to see how highway and gas taxes actually played out across the states, so I located the following map at the American Petroleum Institute’s website. On it we can see which states have high, medium, or low taxes. According to their information the nationwide average is 49.62 cents per gallon. Sixteen states have taxes above 49.5 cents per gallon. Can you guess which ones? Actually, my guess about Utah and Idaho being exceptions was incorrect. Actually, their taxes are close to average so the political affiliation holds true for them as well so something else must be at play in their higher than average gas prices. Possibly their low population density increases the distribution costs.
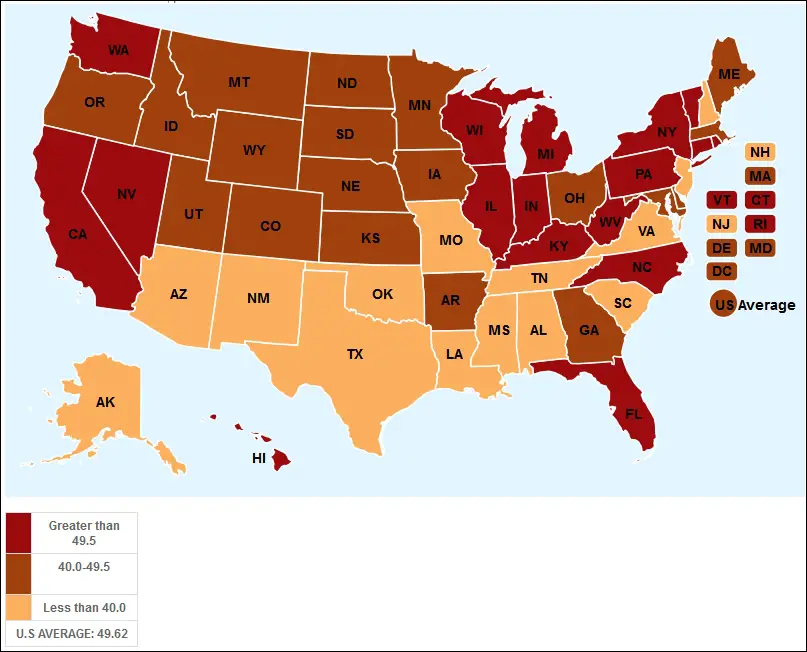
Because gas taxes can vary by locality within a state, the American Petroleum Institute uses a weighted average of local taxes by population of each municipality to come up with an average tax for the entire state. Similarly, the national average is weighted by volume of fuel sold in each state. Because the states with the highest taxes also have higher populations, more states have below average taxes than above average taxes.
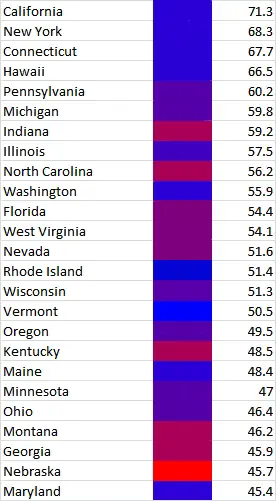
Here is the list of states and their taxes per gallon sorted from highest to lowest. Not surprisingly California is at the top of the list at 71.3 cents per gallon and New York is not far behind at 68.3 cents per gallon.
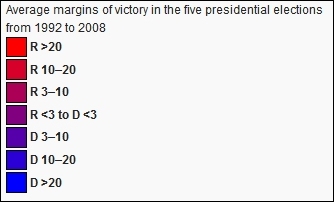
Using the same scale as above with Democrats Blue and Republicans Red.
25 States with the Highest Gas Taxes and Political Affiliation:
State | Political Affiliation | ¢ / Gal. Tax
25 States with the Lowest Gas Taxes and Political Affiliation:
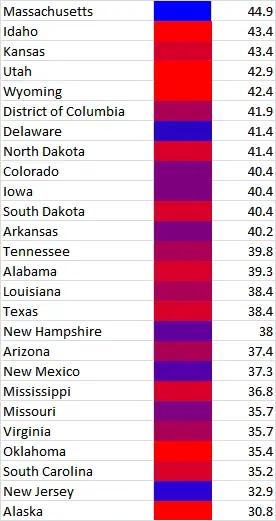
The color difference between the highest taxes and lowest taxes seems pretty clear with just a few exceptions.
Sorted Alphabetically:
| State | Gasoline tax(includes federal tax of 18.4¢/gal) | Diesel tax(includes federal tax of 24.4¢/gal) |
|---|---|---|
| US (Volume-Weighted) Average | 49.9 | 55.4 |
| Alabama | 39.3 | 46.3 |
| Alaska | 30.8 | 37.1 |
| Arizona | 37.4 | 51.4 |
| Arkansas | 40.2 | 47.2 |
| California | 71.3 | 74.0 |
| Colorado | 40.4 | 44.9 |
| Connecticut | 67.7 | 79.3 |
| Delaware | 41.4 | 46.4 |
| District of Columbia | 41.9 | 47.9 |
| Florida | 54.4 | 56.8 |
| Georgia | 45.9 | 55.3 |
| Hawaii | 66.5 | 74.5 |
| Idaho | 43.4 | 49.4 |
| Illinois | 57.5 | 69.3 |
| Indiana | 59.2 | 75.7 |
| Iowa | 40.4 | 47.9 |
| Kansas | 43.4 | 51.4 |
| Kentucky | 48.5 | 51.5 |
| Louisiana | 38.4 | 44.4 |
| Maine | 48.4 | 55.6 |
| Maryland | 45.4 | 52.2 |
| Massachusetts | 44.9 | 50.9 |
| Michigan | 59.8 | 64.2 |
| Minnesota | 47.0 | 53.0 |
| Mississippi | 36.8 | 42.4 |
| Missouri | 35.7 | 41.7 |
| Montana | 46.2 | 52.9 |
| Nebraska | 45.7 | 51.1 |
| Nevada | 51.6 | 53.0 |
| New Hampshire | 38.0 | 44.0 |
| New Jersey | 32.9 | 41.9 |
| New Mexico | 37.3 | 47.3 |
| New York | 68.3 | 74.8 |
| North Carolina | 56.2 | 62.2 |
| North Dakota | 41.4 | 47.4 |
| Ohio | 46.4 | 52.4 |
| Oklahoma | 35.4 | 38.4 |
| Oregon | 49.5 | 54.7 |
| Pennsylvania | 60.2 | 76.5 |
| Rhode Island | 51.4 | 57.4 |
| South Carolina | 35.2 | 41.2 |
| South Dakota | 40.4 | 48.4 |
| Tennessee | 39.8 | 42.8 |
| Texas | 38.4 | 44.4 |
| Utah | 42.9 | 48.9 |
| Vermont | 50.5 | 55.4 |
| Virginia | 35.7 | 50.5 |
| Washington | 55.9 | 61.9 |
| West Virginia | 54.1 | 60.1 |
| Wisconsin | 51.3 | 57.3 |
| Wyoming | 42.4 | 48.4 |
You might also like:
- Inflation Adjusted Gasoline Prices
- Gasoline vs. Crude Oil Prices
- Historical Gas Price Chart
- Current Average Cost of Gas by County
- Average Cost of Gas Per Month
- Calculating Miles Per Gallon
- Regarding Gas Inflation
- Historical Oil Prices Chart
- Gasoline Rewards Credit Cards
- More Inflation Adjusted Prices

It would be interesting to see historic gasoline taxes. I have seen a .jpg file from maybe the 1940s or even the ’50s (based on the vehicles in the background) at a gas station which shows:
Gas 5.5 cents
State: 5 cents
Uncle Sam: 1 cent
City: 1 cent
R.R. (?): 2.25 cents
Agent 1.25 cents
ME (the dealer): 4 cents
Total: 20.5 cents a gallon
I do remember paying 20.5 cents a gallon at a gas station across from Paramount Studios in Hollywod in 1959!
That’s a great breakdown. Wish I had a copy of that picture that I could publish. It looks like even back then people were complaining about his prices and he wanted to clarify that it wasn’t all profit! Most of the money actually went to the Government. (1/3rd). 1/4 went to the refinery, 1/5th went to the local station and the rest went to the agent and whatever the R.R was. (Maybe Railroad for transportation?)