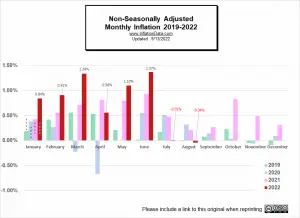
The Bureau of Labor Statistics reported that Annual Inflation for October 2022, fell from 8.20% to 7.75% Monthly inflation at 0.41% was still very high for a month in the fourth quarter, which is traditionally negative or at least very close to zero. But although high, October 2022 monthly inflation was still lower than in October 2021. So… Annual inflation for the 12 months ending in October 2022 fell to 7.75%. This was down from 8.20% in September 2022. Inflation Summary: Annual Inflation fell from 8.20% to 7.75% CPI Index rose from 296.808 to 298.012 Monthly Inflation for October was 0.41% Next release is December 13th October Annual Inflation was 7.75%. Jan. … [Read more...]
November FED Announcement Rocks Stock Market
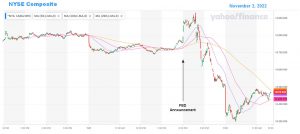
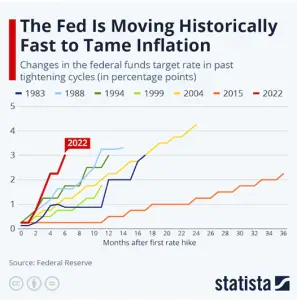
The FED Giveth and the FED Taketh Away On Wednesday, November 2nd, the FED held its "Federal Open Market Committee meeting" and made the announcement the market has been breathlessly awaiting. As expected, Chairman Jerome Powell announced a hike of 75 basis points in the fed funds rate. Along with the announcement, the market was hoping for some indication of a "pivot", i.e., that the FED would give some indication that it was going to be slackening off on its rapid rate increases. And in this respect, the November FED Announcement did throw the market a bone. It added the new phrase “Cumulative Tightening” to the standard announcement. So, going forward, the FED will take the fact … [Read more...]
What is the Reverse Wealth Effect and Why Does the FED Want It?
To understand the reverse wealth effect first we must understand the economic concept of the "Wealth Effect". According to Economics Help the "Wealth Effect" occurs as "Rising personal wealth has a positive effect on consumer spending". In other words, when people feel richer they spend more. The Impact of Increasing Wealth As people feel richer they: Are more willing to spend, borrow and take risks. Re-mortgage and withdraw equity. Invest more resulting in even higher income from dividends, rent, or interest. During a period of rising wealth, we may see a fall in the savings ratio (i.e. they spend more and save less because they feel confident in their income stream). … [Read more...]
September 2022 Inflation Virtually Unchanged
The Bureau of Labor Statistics reported that for September 2022, Annual Inflation fell from 8.26% to 8.20% Inflation Summary: Annual Inflation fell from 8.26% to 8.20% CPI Index rose from 296.171 to 296.808 Monthly Inflation for September was 0.22% Seasonally Adjusted Monthly Inflation was 0.4% Next release November 10th September Annual Inflation was 8.20%. Jan. 2021 -- 1.40% | Jan. 2022 -- 7.48% | Feb. 2022 -- 7.87% | March 8.54% | Apr. 2022 --8.26% May 2022 -- 8.58% | June 2022 -- 9.06% | July 2022 -- 8.56%% | August 2022 -- 8.26% | September -- 8.20% BLS Inflation Report: The BLS Commissioner reported, "The Consumer Price Index for All Urban Consumers (CPI-U) … [Read more...]
Jerome Powell “Channels” His Inner Paul Volcker
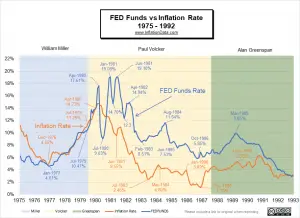
Federal Reserve Chairman Jerome Powell is sounding more and more like former FED Chairman Paul Volcker, who served as the chairman of the Federal Reserve from August 1979 to August 1987. Volcker is best known for his historic fight to vanquish inflation in the early 1980s. Before Volcker took over as the head of the FED, Inflation had risen from a low of 4.65% in December 1976 to 11.26% in July 1979. During that time, FED chairman William Miller raised the FED funds rate from 4.61% to 10.47% in July of 1979. During Miller's time, the FED funds rate pretty much tracked the inflation rate, with a couple of month lag. Prior to Volcker, the prevailing monetary theory was that the FED … [Read more...]
August 2022 is Actually Disinflationary
The Bureau of Labor Statistics reported that in August, Annual Inflation fell from 8.52% to 8.26% Inflation Summary: Annual Inflation fell to 8.26% from a peak of 9.06% in June CPI Index fell from 296.276 to 296.171. Monthly Inflation for August was -0.04% Next release October 13th August 2022, Annual Inflation was 8.26%. Jan. 2021 -- 1.40% | Jan. 2022 -- 7.48% | Feb. 2022 -- 7.87% | March 8.54% | Apr. 2022 --8.26% May 2022 -- 8.58% | June 2022 -- 9.06% | July 2022 -- 8.56%% | August 2022 -- 8.26% BLS Inflation Report: According to the BLS Commissioner: "The Consumer Price Index for All Urban Consumers (CPI-U) rose 0.1 percent in August on a seasonally adjusted basis … [Read more...]
Will Corn Prices Drive Up Inflation?
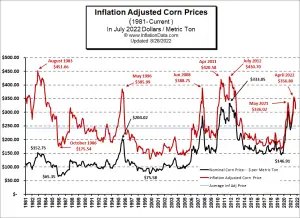
Corn prices peaked in April and began coming down in May, June, and July... but all that may be over. According to Bloomberg corn prices may be set to drive up inflation. Recently they've been running a series of articles on Corn Prices: Their article US Crop Tour Stokes Fears of Looming Corn Shortage says, "Parched soils. Grasshopper infestations. Scorching heat. Hail damage. This year’s US corn crop has been put through the wringer... Things are so bad that scouts currently on a four-day tour through the Midwest are finding plants that are stunted and browning. Scores of fields have visible damage from pests. Cobs of grain are unusually small, and sometimes, stalks aren’t producing the … [Read more...]
Two Ways to Destroy the Economy: Hyperinflation and Central Planning

In the following video, Professor Engelhardt says that if he were a "Super Villain" and wanted to destroy an economy, there are two ways that seem obvious to him. The first is "Central Planning", aka. "Socialism" and the Second is Hyperinflation. Since he would be a lazy super villain, he says Central Planning is "too much work", so he would choose hyperinflation. He goes on to say that hyperinflation is difficult to define; even Economists like Murray Rothbard and Ludwig Von Mises used different definitions of plain inflation depending on the context. Generally, inflation was originally defined as an "increase in the money supply in excess of the increase in the demand for money". More … [Read more...]
Gas Prices Fall, Bringing Down July 2022 Inflation
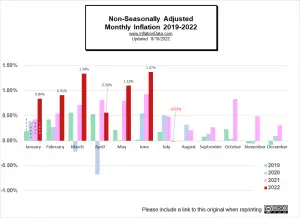
The Bureau of Labor Statistics reported that in July 2022, Annual Inflation fell from 9.1% to 8.52% Inflation Summary: July 2022 Annual Inflation fell to 8.52% CPI Index declined slightly from 296.311 to 296.276 Monthly Inflation for July was -0.01% down from 1.37% in June. The next release is on September 13th July 2022, Annual Inflation was 8.52%. Jan. 2021 -- 1.40% ** Jan. 2022 -- 7.48% ** Feb. 2022 -- 7.87% ** March 8.54% Apr. 2022 --8.26% ** May 2022 -- 8.58% ** June 2022 -- 9.06% ** July 2022 -- 8.56%% Crude Oil prices averaged over $107.10 per barrel for June and averaged $93.12 in July. While according to the AAA, Regular Gasoline prices averaged $4.99 … [Read more...]
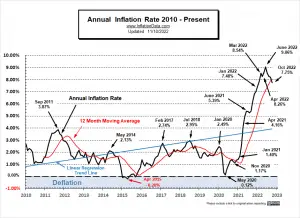
Total U.S. Cumulative Inflation
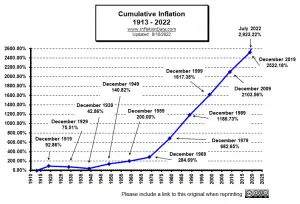
How Much Inflation have we had since 1913? Just like compound interest, "compound inflation" grows faster and faster. So, even though the average annual inflation since 1913 has been "only" 3.24% PER YEAR. After over 100 years, the total cumulative inflation becomes astronomical. See Average Annual Inflation Rates by Decade to see how each decade stacked up. As you can see from the chart below, compounding something for over 100 years at 3.24% will result in well over 2000% inflation. The Consumer Price index (CPI-U) for January 1913 was 9.8. The CPI-U for July 2022 was 296.276. This means that something that cost $9.80 in January 1913 would cost $296.28 in July of … [Read more...]
