
The Bureau of Labor Statistics reported that in July 2022, Annual Inflation fell from 9.1% to 8.52%
Inflation Summary:
- July 2022 Annual Inflation fell to 8.52%
- CPI Index declined slightly from 296.311 to 296.276
- Monthly Inflation for July was -0.01% down from 1.37% in June.
- The next release is on September 13th
July 2022, Annual Inflation was 8.52%.
Jan. 2021 — 1.40% ** Jan. 2022 — 7.48% ** Feb. 2022 — 7.87% ** March 8.54%
Apr. 2022 –8.26% ** May 2022 — 8.58% ** June 2022 — 9.06% ** July 2022 — 8.56%%
Crude Oil prices averaged over $107.10 per barrel for June and averaged $93.12 in July.
While according to the AAA, Regular Gasoline prices averaged $4.99 in mid-June and $4.63 in mid-July.
Monthly Inflation
Fell to virtually zero for July 2022.
At 0.84% (January), 0.91% (February), and 1.34% (March), monthly inflation was high even for the first quarter of the year, when monthly inflation is typically at its highest. April and July are the only months so far this year to come in lower than 2021. Monthly Inflation for June was 1.37%, the highest June since 1941.
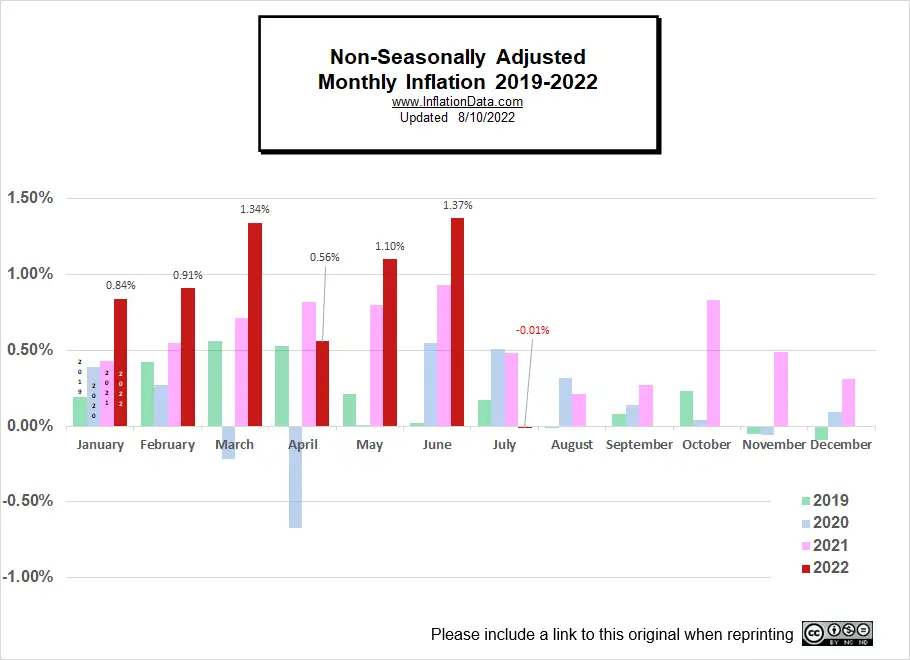
Not Seasonally Adjusted Monthly Inflation Rates
Note: January 2022’s 0.84% was the highest January since 1990. June was the highest June since 1941 (although the first quarter of 1980 had some higher rates). Typically, June is the beginning of lower monthly rates.
| Jan | Feb | Mar | Apr | May | Jun | Jul | Aug | Sep | Oct | Nov | Dec | |
| 2016 | 0.17% | 0.08% | 0.43% | 0.47% | 0.41% | 0.33% | (0.16%) | 0.09% | 0.24% | 0.12% | (0.16%) | 0.03% |
| 2017 | 0.58% | 0.31% | 0.08% | 0.30% | 0.09% | 0.09% | (0.07%) | 0.30% | 0.53% | (0.06%) | 0.002% | (0.06%) |
| 2018 | 0.54% | 0.45% | 0.23% | 0.40% | 0.42% | 0.16% | 0.01% | 0.06% | 0.12% | 0.18% | (0.33%) | (0.32%) |
| 2019 | 0.19% | 0.42% | 0.56% | 0.53% | 0.21% | 0.02% | 0.17% | (0.01%) | 0.08% | 0.23% | (0.05%) | (0.09%) |
| 2020 | 0.39% | 0.27% | (0.22%) | (0.67%) | 0.002% | 0.55% | 0.51% | 0.32% | 0.14% | 0.04% | (0.06%) | 0.09% |
| 2021 | 0.43% | 0.55% | 0.71% | 0.82% | 0.80% | 0.93% | 0.48% | 0.21% | 0.27% | 0.83% | 0.49% | 0.31% |
| 2022 | 0.84% | 0.91% | 1.34% | 0.56% | 1.10% | 1.37% | (0.01%) |
See: Monthly Inflation Rate for more information and a complete table of Unadjusted Monthly Rates.
BLS July 2022 Inflation Report:
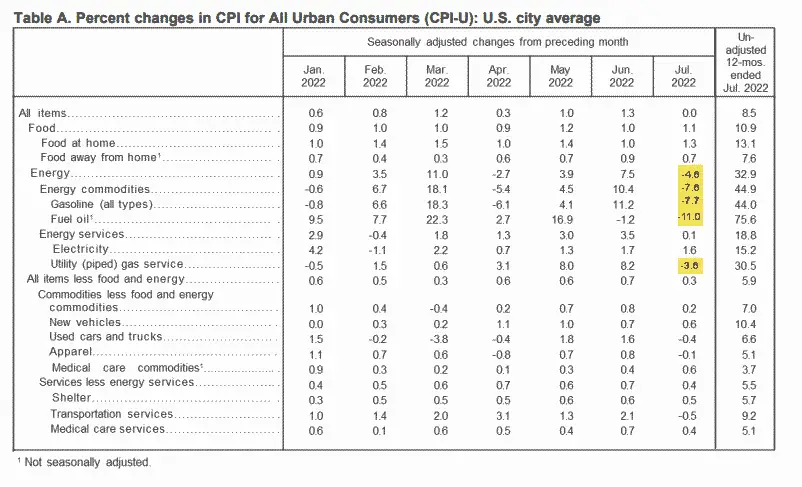
The BLS Commissioner reported: “The Consumer Price Index for All Urban Consumers (CPI-U) was unchanged in July on a seasonally adjusted basis after rising 1.3 percent in June, the U.S. Bureau of Labor Statistics reported today. Over the last 12 months, the all items index increased 8.5 percent before seasonal adjustment.
The gasoline index fell 7.7 percent in July and offset increases in the food and shelter indexes, resulting in the all items index being unchanged over the month. The energy index fell 4.6 percent over the month as the indexes for gasoline and natural gas declined, but the index for electricity increased. The food index continued to rise, increasing 1.1 percent over the month as the food at home index rose 1.3 percent.
The index for all items less food and energy rose 0.3 percent in July, a smaller increase than in April, May, or June. The indexes for shelter, medical care, motor vehicle insurance, household furnishings and operations, new vehicles, and recreation were among those that increased over the month. There were some indexes that declined in July, including those for airline fares, used cars and trucks, communication, and apparel. “
The BLS reports inflation to one decimal place so they reported July 2022 inflation as 8.5%, June as 9.1% and May as 8.6% but since we look at the numbers to two decimal places we see that they were 8.52%, 9.06% and 8.58% respectively. So May and July are even closer than the BLS numbers would indicate.
The major factor reducing July inflation was lower energy prices as most other prices still increased. But The entire energy sector was down -4.6% and gasoline was down -7.7%.
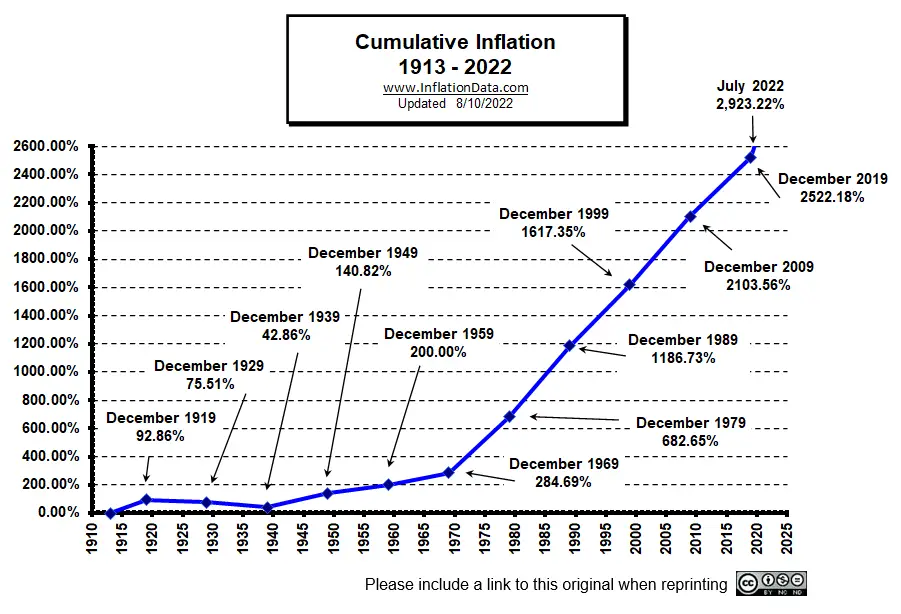
Cumulative Inflation
Although the media might be celebrating July 2022’s decline in inflation we need to remember that at 8.5% annual inflation prices double in just over 8 years. Cumulative inflation is constantly eroding your purchasing power. Inflation over the long term has averaged 3.24% and even at that we have almost 3000% inflation since the FED was created in 1913. This month we’ve updated our Cumulative Inflation Chart.
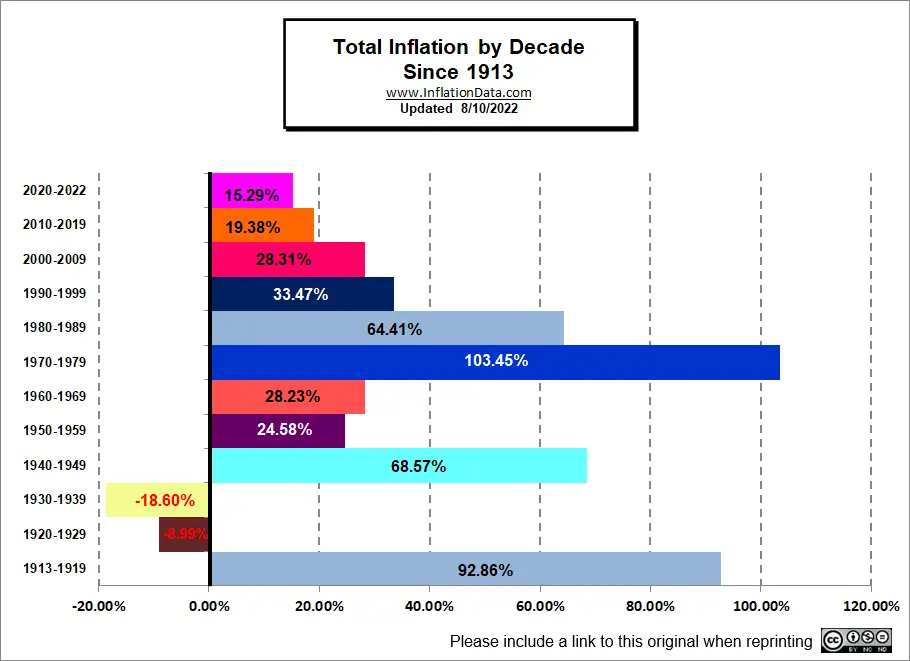
And our Total inflation by decade chart. As you can see in the first two years of this decade we’ve seen almost as much inflation as in the entire last decade. Also, note that despite the fact that last decade had very low annual inflation prices still increased by almost 20% during that time period. So even very low inflation adds up.
Read more about Cumulative Inflation here.
Here’s what legendary Economist Milton Friedman has to say about inflation:
Inflation All Items vs. Core Inflation Chart
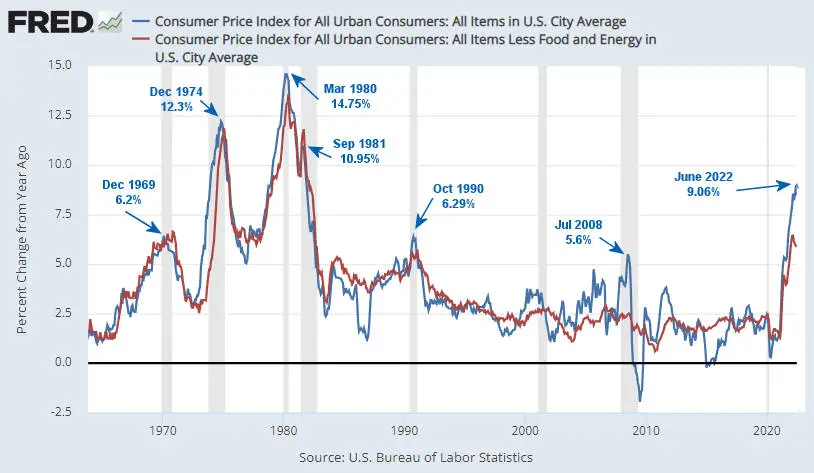
Looking at the chart above from the St. Louis FED, we can see the difference between inflation with food and energy and without. The red line shows the annual inflation rate minus food and energy. Where the blue line is below the red line is generally significant drops in the oil price, like in early 2020 when oil prices went to zero. Previous peaks were 5.60% in July 2008 and 6.29% in October 1990. The last time inflation was higher was in December 1981 when it was 8.92%, but in those days, it had declined from 14.76% in March of 1980.
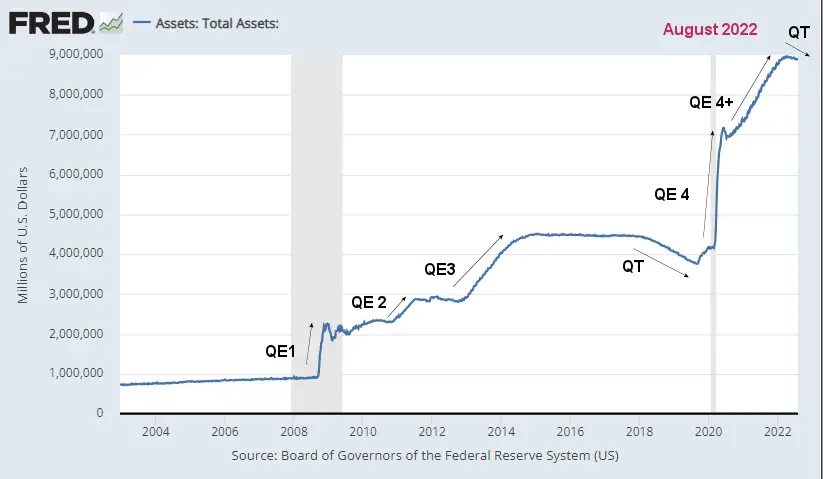
The FED’s total assets have started to level out and even declined a bit, but there is a long way to go to get back to 2019 levels, and that will involve a lot of economic pain, so the question is if the FED will chicken out before it gets there.
Moore Inflation Predictor
Unfortunately, even our most pessimistic inflation projection was too low for June and then we were too high for July 2022. But if we go back to March our projection looks pretty good.
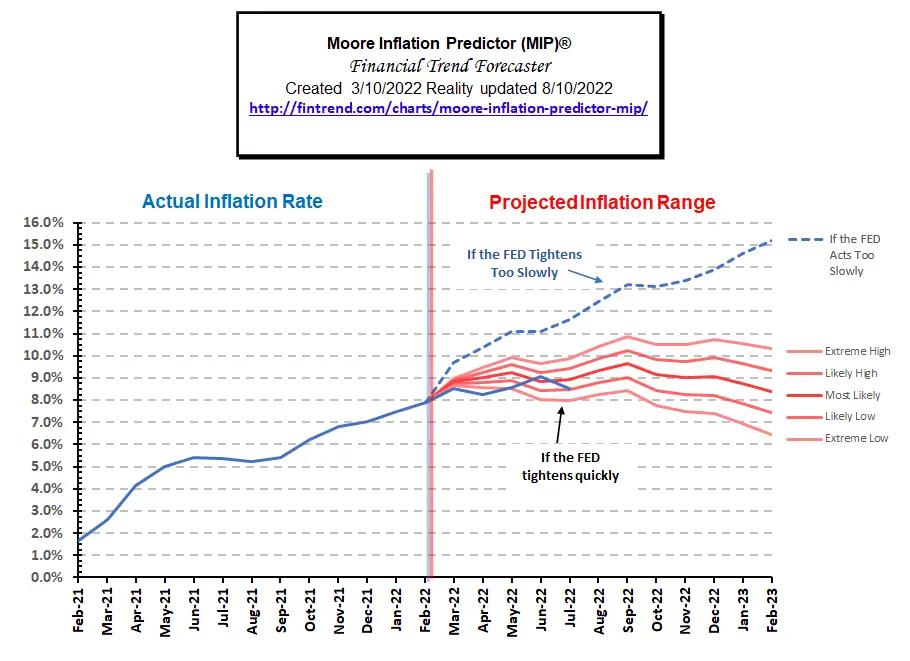
See our current inflation projections here.
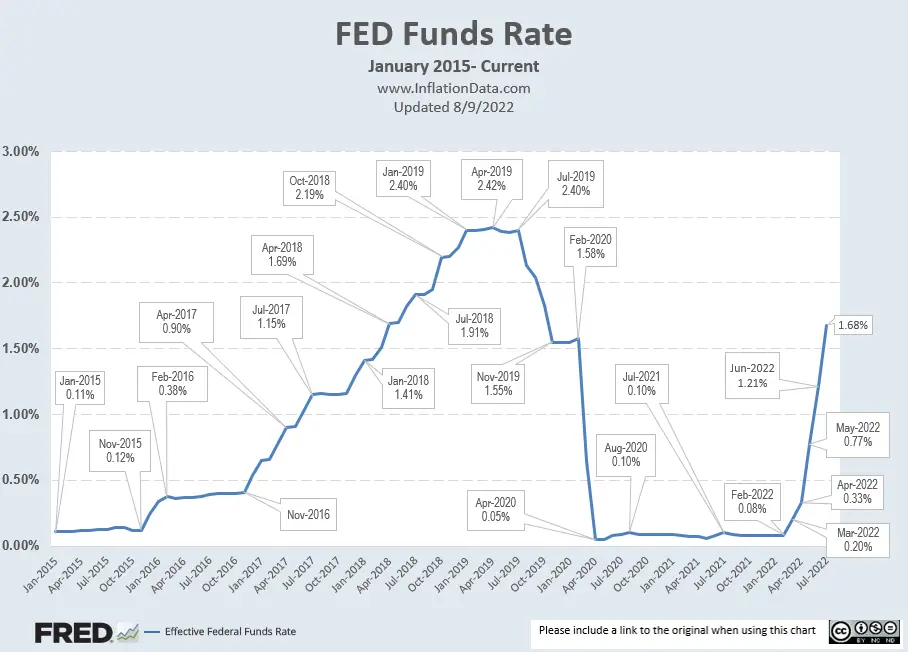
FED Funds Rate
In June 2022, the FED raised interest rates to 1.21% and in July they raised it again to 1.68%
 Although the FED’s announcement sounds aggressive, many commentators don’t believe it is enough to fight inflation. Jeffrey Tucker says, “The Fed’s theory is that it can put out the house fire by carefully spraying a bit of water here and there in a way that doesn’t cause shock and alarm.”
Others are saying to be economically viable short-term interest rates need to be higher than the inflation rate, i.e., investors need to earn a “real rate of return”.
As recently as 2019, rates were at 2.42%. In 2007 they were over 5%, and the last time inflation was this high, rates were at 14.94% to combat inflation.
Chart Data Source St Louis FED.
For more info, See NYSE ROC and MIP.
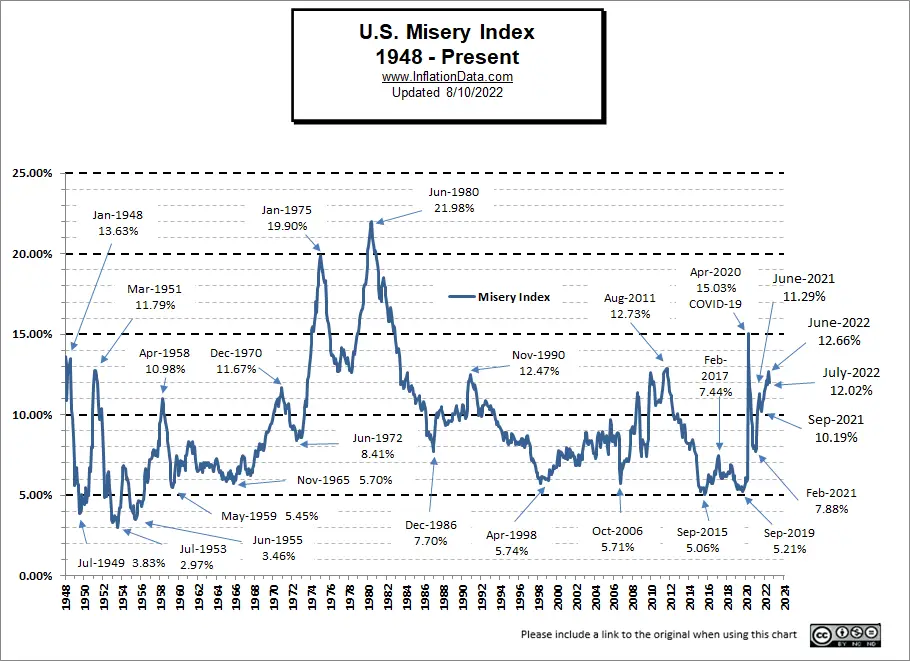
Misery Index
Unemployment was unchanged in April, and Inflation was down slightly, so the Misery index decreased.
| Unemployment | Inflation | Misery Index | |
| January 2022 | 4.0% | 7.48% | 11.48% |
| February 2022 | 3.8% | 7.87% | 11.67% |
| March 2022 | 3.6% | 8.54% | 12.14% |
| April 2022 | 3.6% | 8.26% | 11.86% |
| May 2022 | 3.6% | 8.58% | 12.18% |
| June 2022 | 3.6% | 9.06% | 12.66% |
| July 2022 | 3.5% | 8.52% | 12.02% |
[Read More…]
NYSE Rate of Change (ROC)©

Sell Signal
The NYSE ROC index rebounded but is still WAY below its moving average.
See the NYSE ROC for more info.
NASDAQ Rate of Change (ROC)©

Sell Signal
The NASDAQ ROC remains well below its moving average too.
See NASDAQ ROC for more.
You Might Also Like:
From InflationData.com
- Have Commodity Prices Peaked? Does That mean Recession?
- 2022: Highest June Inflation Since 1941
- The Many Evils of Inflation
- July 4th Cookout Will Cost You 17% More in 2022
From UnemploymentData.com.
- July 2022 Jobs Report- Not as Rosy as They’d Have You Believe
- Is the Average Worker “Falling Behind”?
- 4 Ways to Keep Good Employees at Your Company for Longer
- June 2022 BLS Jobs Report- Recession Indicators?
From Financial Trend Forecaster
- NYSE ROC Chart
- NASDAQ ROC Chart
- The Age of Empires – U.S. vs. China
- How Low Can the S&P 500 Go?
- France’s War on Terror Uses Eagles to Catch Drones
- The Fed’s New “Tightening” Plan Is Too Little, Too Late
- Keynesians and Market Monetarists Didn’t See Inflation Coming
From Elliott Wave University
- What the “Housing Busts” Indicator Is Saying Now
- How to Prepare for a Hard-Hitting Bear Market (Think 1929-1932)
- The Dow 8 Waves are Incomplete
- What to Make of the Stock Market’s Bounce
- Is the Correction Over Yet?
From OptioMoney
- Financial Mistakes to Avoid After College
- Common Tax Mistakes That You Need To Avoid
- 6 Passive Income Ideas to Grow Your Wealth
- Surprising Ways a Storage Unit Can Save You Money
- Guide to Managing Small Business Finances
From Your Family Finances
- Why Personal Insurance Is Essential
- Own a Small Farm and a House? How to Balance Insurance Needs
- Financial Institutions: Differences Between Credit Unions And Banks
- How to Retire in 7 Years
- Qualifying for a Car Loan

Leave a Reply