
The Bureau of Labor Statistics reported that for September 2022, Annual Inflation fell from 8.26% to 8.20%
Inflation Summary:
- Annual Inflation fell from 8.26% to 8.20%
- CPI Index rose from 296.171 to 296.808
- Monthly Inflation for September was 0.22%
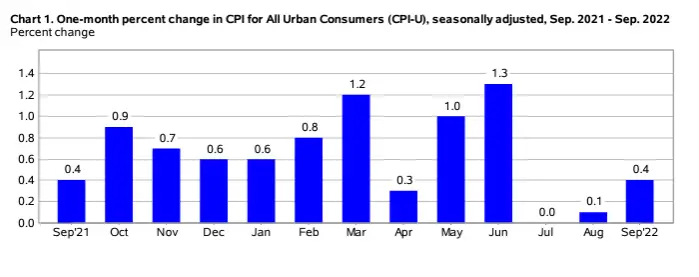
- Seasonally Adjusted Monthly Inflation was 0.4%
- Next release November 10th
September Annual Inflation was 8.20%.
Jan. 2021 — 1.40% | Jan. 2022 — 7.48% | Feb. 2022 — 7.87% | March 8.54% | Apr. 2022 –8.26%
May 2022 — 8.58% | June 2022 — 9.06% | July 2022 — 8.56%% | August 2022 — 8.26% | September — 8.20%
BLS Inflation Report:
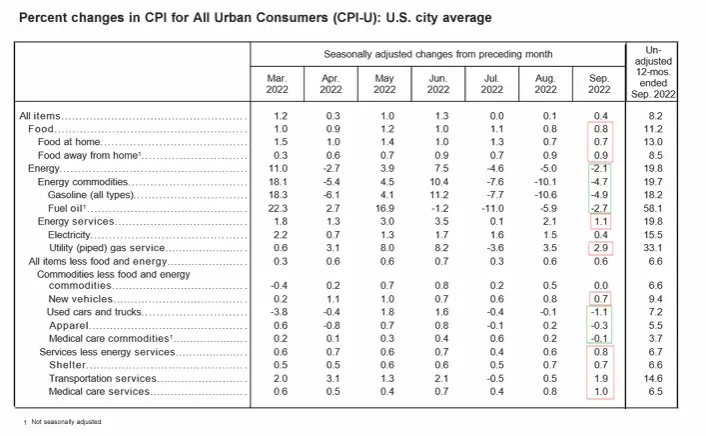
The BLS Commissioner reported, “The Consumer Price Index for All Urban Consumers (CPI-U) rose 0.4 percent in September on a seasonally adjusted basis after rising 0.1 percent in August, the U.S. Bureau of Labor Statistics reported today. Over the last 12 months, the all-items index increased 8.2 percent before seasonal adjustment.
Increases in the shelter, food, and medical care indexes were the largest of many contributors to the monthly seasonally adjusted all items increase. These increases were partly offset by a 4.9-percent decline in the gasoline index. The food index continued to rise, increasing 0.8 percent over the month as the food at home index rose 0.7 percent. The energy index fell 2.1 percent over the month as the gasoline index declined, but the natural gas and electricity indexes increased.”
On an annual (non-adjusted) basis, inflation actually fell slightly from 8.26% to 8.20% or 6/100ths of a percent. This is virtually zero.
Looking at the monthly changes in the chart below, we can see that Food increased 8/10ths of a percent while energy fell -2.1%. New vehicles rose 7/10ths of a percent while used vehicles fell -1.1%. Shelter, Transportation, and Medical all rose.
Note: Monthly Increases are circled in red, and decreases are circled in green.
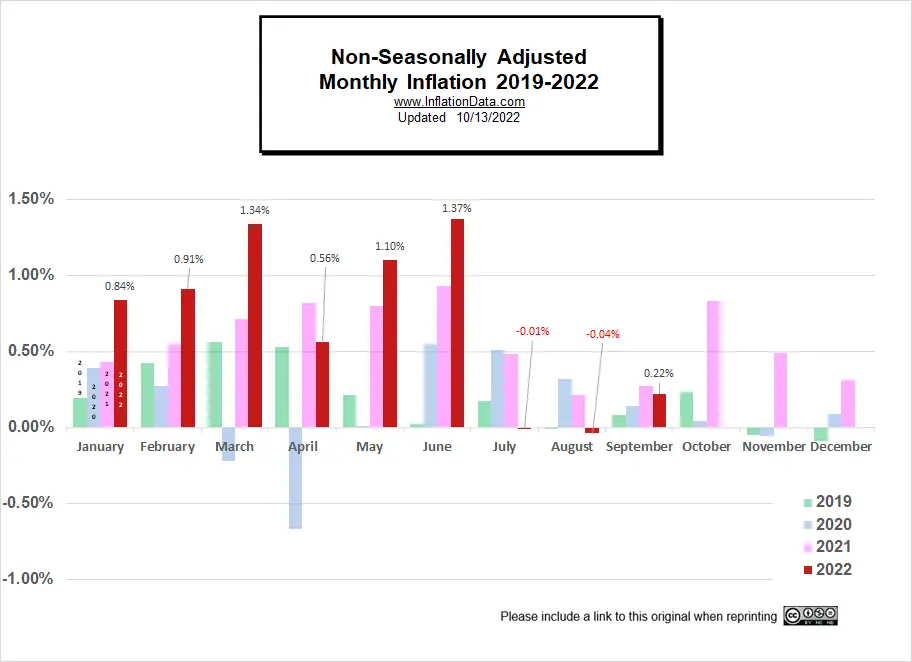
Monthly Inflation Compared to Previous Years:
Although July and August were significantly lower than the previous couple of years, September 2022 was only slightly lower than September 2021. Because of the extremely high 2021 numbers, the next three months should be lower than 2021, bringing annual inflation down.
On a (monthly) seasonally adjusted basis, we can see that July, August, and September were all adjusted up compared to their unadjusted numbers.
 Not Seasonally Adjusted Monthly Inflation Rates
Note: January 2022’s 0.84% was the highest January since 1990. June was the highest June since 1941 (although the first quarter of 1980 had some higher rates). Typically, June is the beginning of lower monthly rates.
| Jan | Feb | Mar | Apr | May | Jun | Jul | Aug | Sep | Oct | Nov | Dec | |
| 2016 | 0.17% | 0.08% | 0.43% | 0.47% | 0.41% | 0.33% | (0.16%) | 0.09% | 0.24% | 0.12% | (0.16%) | 0.03% |
| 2017 | 0.58% | 0.31% | 0.08% | 0.30% | 0.09% | 0.09% | (0.07%) | 0.30% | 0.53% | (0.06%) | 0.002% | (0.06%) |
| 2018 | 0.54% | 0.45% | 0.23% | 0.40% | 0.42% | 0.16% | 0.01% | 0.06% | 0.12% | 0.18% | (0.33%) | (0.32%) |
| 2019 | 0.19% | 0.42% | 0.56% | 0.53% | 0.21% | 0.02% | 0.17% | (0.01%) | 0.08% | 0.23% | (0.05%) | (0.09%) |
| 2020 | 0.39% | 0.27% | (0.22%) | (0.67%) | 0.002% | 0.55% | 0.51% | 0.32% | 0.14% | 0.04% | (0.06%) | 0.09% |
| 2021 | 0.43% | 0.55% | 0.71% | 0.82% | 0.80% | 0.93% | 0.48% | 0.21% | 0.27% | 0.83% | 0.49% | 0.31% |
| 2022 | 0.84% | 0.91% | 1.34% | 0.56% | 1.10% | 1.37% | (0.01%) | (0.04%) | 0.22% |
See: Monthly Inflation Rate for more information and a complete table of Unadjusted Monthly Rates.
Inflation Forecast
Reality is running slightly below our August projection in the wake of the FED’s aggressive tightening and SPR oil releases. This is encouraging after their slow start earlier this year. The only caveat I’ve heard is that, hopefully, they won’t overdo it to make up for the late start.
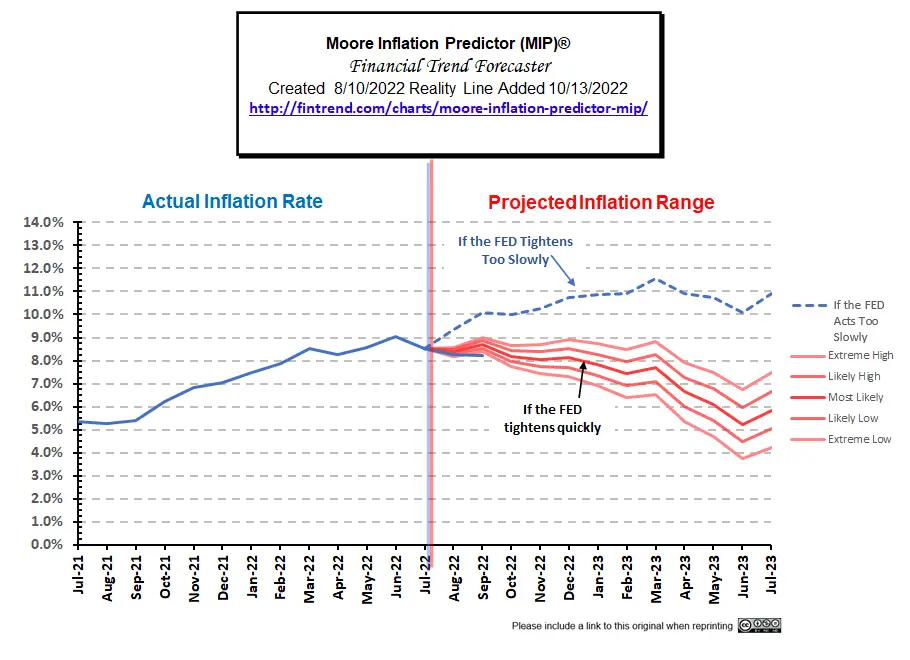 See this month’s MIP Chart here.
Inflation All Items vs. Core Inflation Chart
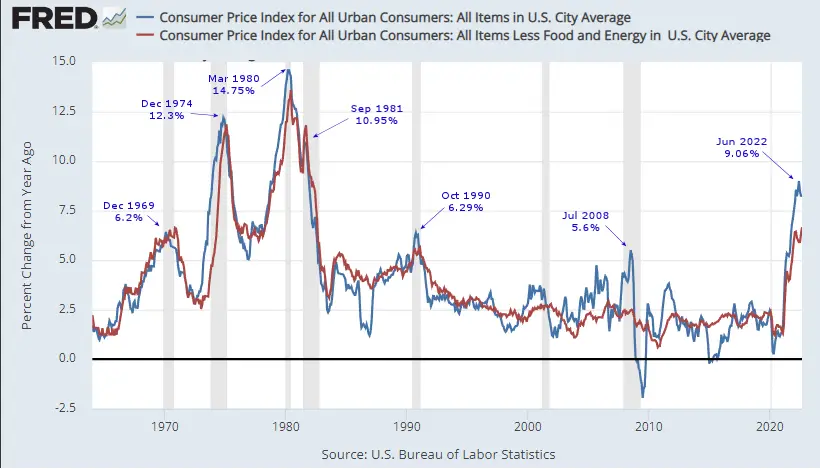
Looking at the chart above from the St. Louis FED, we can see the difference between inflation with food and energy and without. The red line shows the annual inflation rate minus food and energy. Where the blue line is below the red line is generally significant drops in the oil price, like in early 2020 when oil prices went to zero. Previous peaks were 5.60% in July 2008 and 6.29% in October 1990. The last time inflation was higher was in December 1981 when it was 8.92%, but in those days, it had declined from 14.76% in March of 1980.
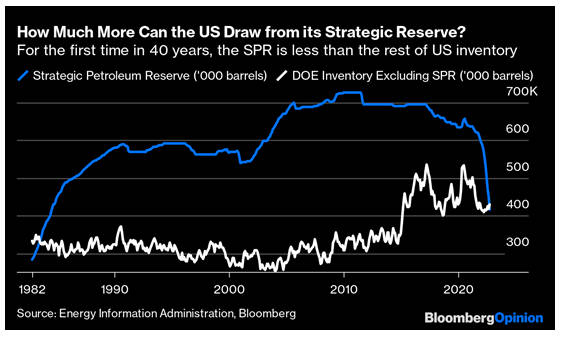
Crude Oil
In an effort to keep oil prices low, the Biden administration has been draining the Strategic Petroleum Reserve (SPR) but that can’t continue forever. And with OPEC cutting production, that may be the final straw. This chart from Bloomberg illustrates the current situation.
We’ve updated the Inflation-adjusted crude oil price chart.
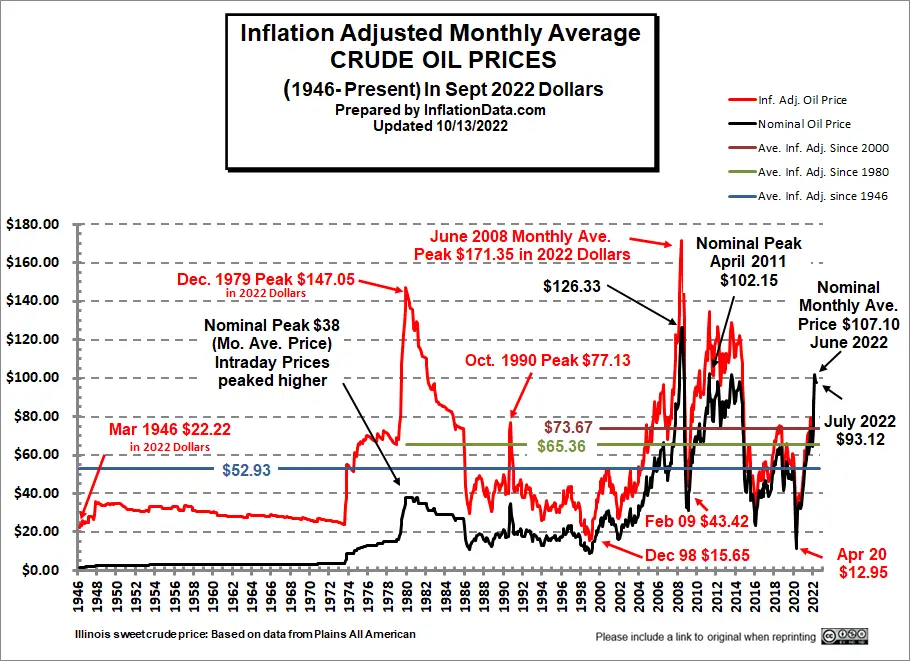 Read more and see historical Crude Oil prices here.
FED Assets
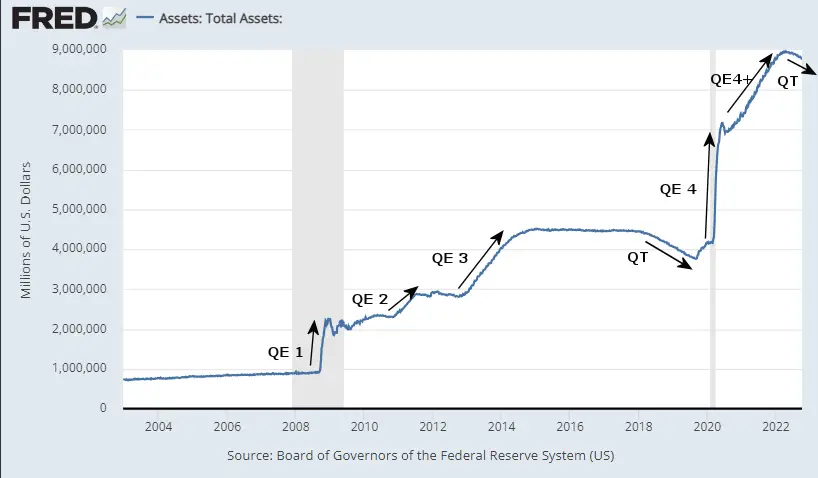
The FED’s total assets have started to level out and even declined a bit, but there is a long way to go to get back to 2019 levels, and that will involve a lot of economic pain, so the question is if the FED will chicken out before it gets there.
The FED’s Interest Rate Policy
The chart below shows that the FED has raised rates sharply from 0.08% in February to 2.56% in September, bringing levels slightly above 2019 levels. The market is now expecting a monthly increase of .75%, but some people like Scott Buchta at Brean Capital are calling for more, i.e., a full 1%. Although I think the FED was late coming to this party, there is no reason for them to go crazy overreacting.
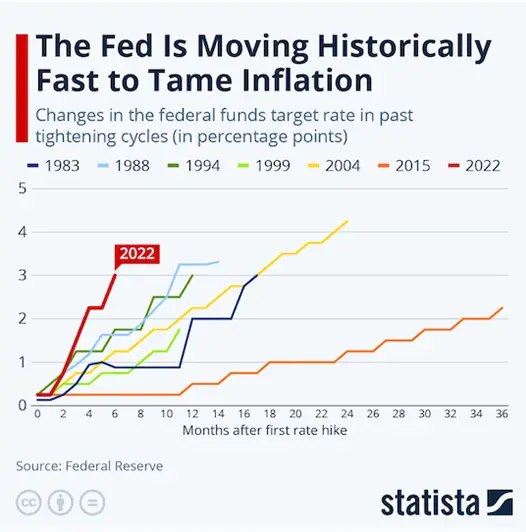
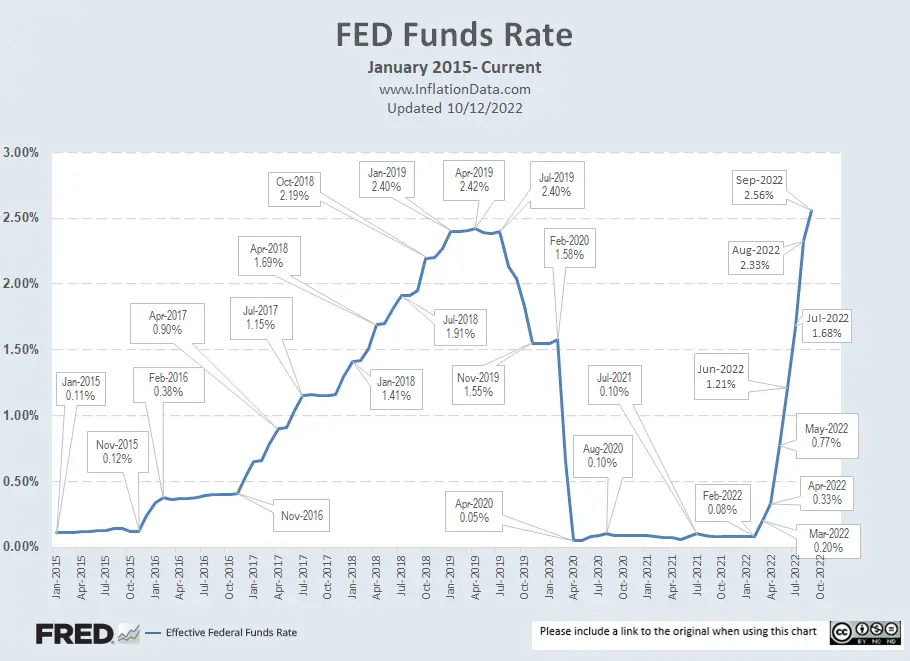 Although the FED’s announcement sounds aggressive, many commentators don’t believe it is enough to fight inflation. However, on a historic basis it is moving more aggressively than usual but that may be to make up for its late start and lower starting point.
Looking at the longer-term chart, we can see that on a historical basis, current levels are still low. Despite all the raising, prior to 2008, there are only a couple of instances where rates have been as low as they are now.
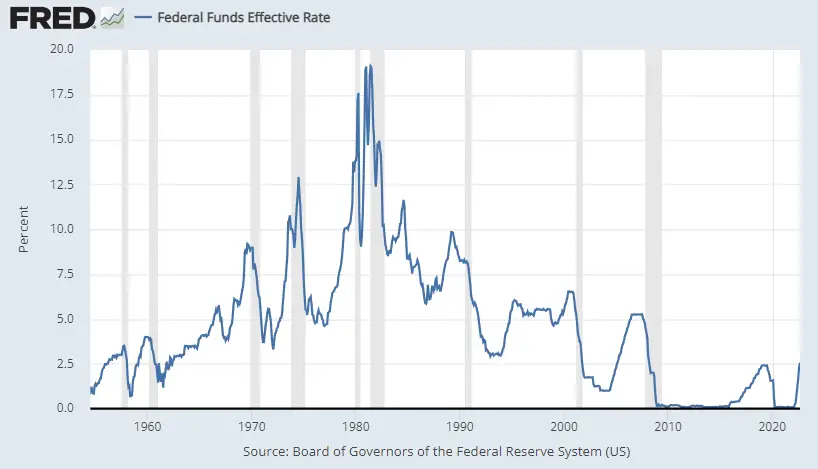
Chart Data Source St Louis FED.
For more info, See NYSE ROC and MIP.
Misery Index
Unemployment was down in September, and Inflation was also down slightly, so the Misery index decreased.
| Unemployment | Inflation | Misery Index | |
| January 2022 | 4.0% | 7.48% | 11.48% |
| February 2022 | 3.8% | 7.87% | 11.67% |
| March 2022 | 3.6% | 8.54% | 12.14% |
| April 2022 | 3.6% | 8.26% | 11.86% |
| May 2022 | 3.6% | 8.58% | 12.18% |
| June 2022 | 3.6% | 9.06% | 12.66% |
| July 2022 | 3.5% | 8.52% | 12.02% |
| August 2022 | 3.7% | 8.26% | 11.96% |
| September 2022 | 3.5% | 8.2% | 11.70% |

[Read More on the Misery Index…]
NYSE Rate of Change (ROC)©

Sell Signal
The NYSE ROC index is still WAY below its moving average.
See the NYSE ROC for more info.
NASDAQ Rate of Change (ROC)©

Sell Signal
The NASDAQ ROC remains well below its moving average too.
See NASDAQ ROC for more.
You Might Also Like:
From InflationData.com
- Jerome Powell “Channels” His Inner Paul Volcker
- August 2022 is Actually Disinflationary
- Everything They Tell You About Inflation is Wrong
- Will Corn Prices Drive Up Inflation?
- Two Ways to Destroy the Economy: Hyperinflation and Central Planning
- Gas Prices Fall, Bringing Down July 2022 Inflation
- Total U.S. Cumulative Inflation
From UnemploymentData.com.
- September Unemployment Falls… Dragging Market Down
- Injured on the Job? 3 Things to Immediately Do
- 5 Signs It’s Time to Make a Career Change
- Building Confidence to Help You Reenter the World
From Financial Trend Forecaster
- NYSE ROC Chart
- NASDAQ ROC Chart
- Are Housing Prices Set to Crash?
- Half-Way to the Stock Market’s Worst Case Scenario
- Don’t Fight the FED
- Non-Fungible Tokens (NFTs): Another Financial “Fumble”
- Will Loan Forgiveness Raise College Costs?
From Elliott Wave University
- Will Another “Great Depression” Start in Europe?
- Stocks Don’t Go Straight Up (or Straight Down)
- What the “Housing Busts” Indicator Is Saying Now
- How to Prepare for a Hard-Hitting Bear Market (Think 1929-1932)
- The Dow 8 Waves are Incomplete
From OptioMoney
- Warning Signs You’re On the Road to Financial Catastrophe
- Money Habits That Can Help You Retire Early
- 7 Ways to Save Money When Living in a Big City
- How Addiction Can Cause Financial Trouble
- Common Mistakes to Avoid When Investing in Real Estate
From Your Family Finances
- Documents You’ll Need When Buying Your First Home
- Devastating Budget Buster Or Timely Car Repair?
- 7 Ways To Save Money This Fall
- 7 Ways a Tax Lawyer Can Help With Your Personal Finances
- Prepare For Unexpected Costs When Moving Across State Lines

Leave a Reply