
The Bureau of Labor Statistics reported that in August, Annual Inflation fell from 8.52% to 8.26%
Inflation Summary:
- Annual Inflation fell to 8.26% from a peak of 9.06% in June
- CPI Index fell from 296.276 to 296.171.
- Monthly Inflation for August was -0.04%
- Next release October 13th
August 2022, Annual Inflation was 8.26%.
Jan. 2021 — 1.40% | Jan. 2022 — 7.48% | Feb. 2022 — 7.87% | March 8.54% | Apr. 2022 –8.26%
May 2022 — 8.58% | June 2022 — 9.06% | July 2022 — 8.56%% | August 2022 — 8.26%
BLS Inflation Report:
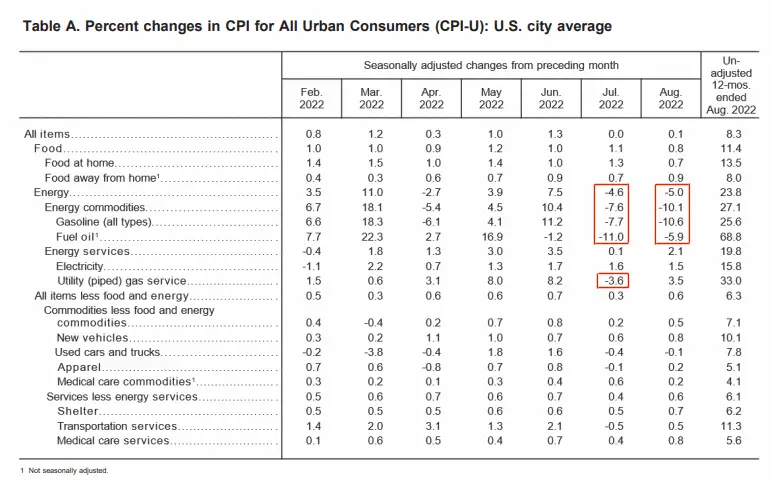
According to the BLS Commissioner: “The Consumer Price Index for All Urban Consumers (CPI-U) rose 0.1 percent in August on a seasonally adjusted basis after being unchanged in July, the U.S. Bureau of Labor Statistics reported today. Over the last 12 months, the all items index increased 8.3 percent before seasonal adjustment.”
At first glance, this makes it sound like inflation is up… but it is only monthly inflation on a “Seasonally Adjusted” basis. Monthly inflation was actually down -0.04% i.e. 4/100ths of 1% (virtually zero) on a non-adjusted basis. Annual inflation was down from 8.52% in July to 8.26% in August, making it exactly the same as it was back in April.
The driving force behind the decline was a decrease in energy prices. However, everything besides energy was up 0.6% over the month. Annualizing 0.6% results in an annual inflation rate of 7.2%.
Current Inflation Forecast
Last month in our MIP forecast we said…
“The energy sector is the driving factor reducing the index this month with the other sectors still gaining. The media may hail this as a “win” but we need to remember that at 8.5% inflation, prices DOUBLE in a little over 8 years!”
The market is finally catching on to this fact because despite the decrease in the annual inflation rate from 8.52% to 8.26% the market threw a tantrum and the NYSE fell 525 points or -3.4%. The “experts” were projecting a bigger decrease in annual inflation so when they didn’t get it the market fell sharply.
Obviously, they weren’t reading our projections because we got it exactly right. We projected a median of 8.39%, a likely low of 8.29%, and an extreme low of 8.19%, so at 8.26%, it came in almost exactly on our likely low projection.
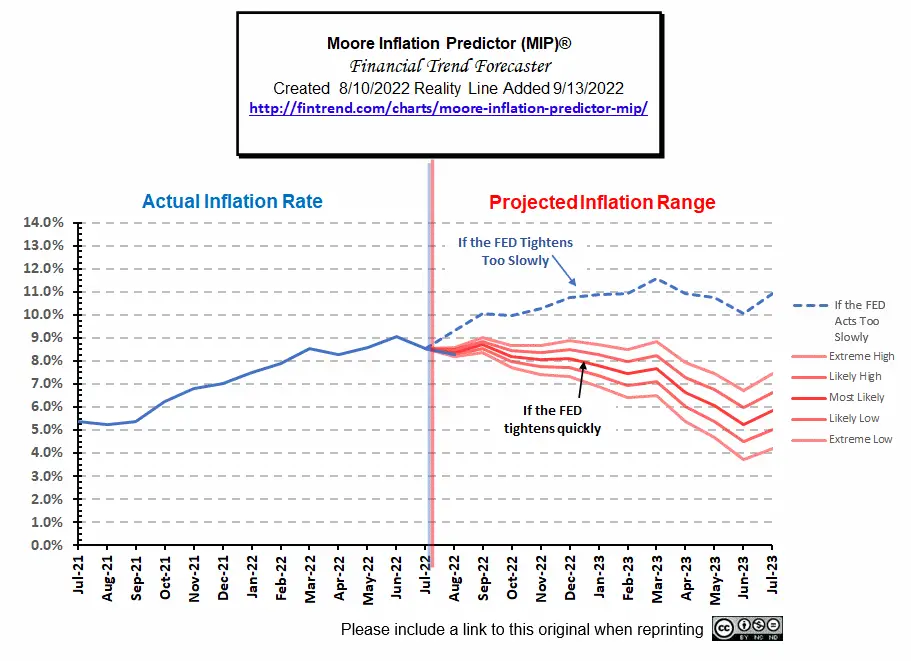 See this month’s MIP Chart here.
Monthly Inflation
Fell to virtually zero for August 2022.
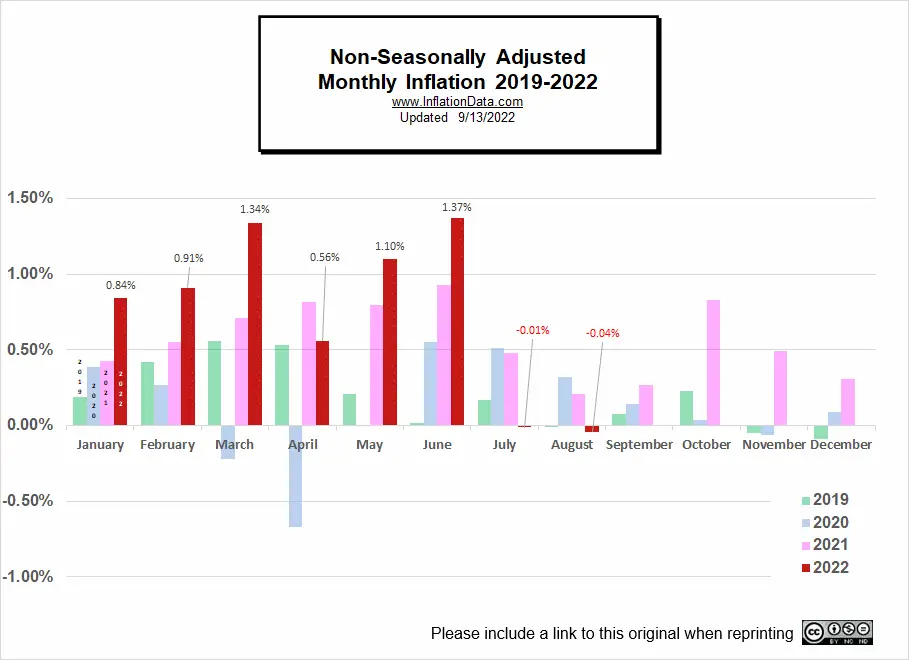
At 0.84% (January), 0.91% (February), and 1.34% (March), monthly inflation was high even for the first quarter of the year, when monthly inflation is typically at its highest. April, July and August are the only months so far this year to come in lower than 2021.
Monthly Inflation for June was 1.37%, the highest June since 1941. July and August were both slightly negative, resulting in Disinflation. Of course, that is still a long way away from deflation.
Looking at this chart, we can see the effect that a monthly rate has on the overall annual rate. In August, the pink monthly number was replaced by the red negative number resulting in a decrease in annual inflation from 8.52% to 8.26%. Looking out to October through December if those large pink lines are replaced by red lines equal to August’s slightly negative one, annual inflation will fall by roughly 1.75%.
Not Seasonally Adjusted Monthly Inflation Rates
Note: January 2022’s 0.84% was the highest January since 1990. June was the highest June since 1941 (although the first quarter of 1980 had some higher rates). Typically, June is the beginning of lower monthly rates.
| Jan | Feb | Mar | Apr | May | Jun | Jul | Aug | Sep | Oct | Nov | Dec | |
| 2016 | 0.17% | 0.08% | 0.43% | 0.47% | 0.41% | 0.33% | (0.16%) | 0.09% | 0.24% | 0.12% | (0.16%) | 0.03% |
| 2017 | 0.58% | 0.31% | 0.08% | 0.30% | 0.09% | 0.09% | (0.07%) | 0.30% | 0.53% | (0.06%) | 0.002% | (0.06%) |
| 2018 | 0.54% | 0.45% | 0.23% | 0.40% | 0.42% | 0.16% | 0.01% | 0.06% | 0.12% | 0.18% | (0.33%) | (0.32%) |
| 2019 | 0.19% | 0.42% | 0.56% | 0.53% | 0.21% | 0.02% | 0.17% | (0.01%) | 0.08% | 0.23% | (0.05%) | (0.09%) |
| 2020 | 0.39% | 0.27% | (0.22%) | (0.67%) | 0.002% | 0.55% | 0.51% | 0.32% | 0.14% | 0.04% | (0.06%) | 0.09% |
| 2021 | 0.43% | 0.55% | 0.71% | 0.82% | 0.80% | 0.93% | 0.48% | 0.21% | 0.27% | 0.83% | 0.49% | 0.31% |
| 2022 | 0.84% | 0.91% | 1.34% | 0.56% | 1.10% | 1.37% | (0.01%) | (0.04%) |
See: Monthly Inflation Rate for more information and a complete table of Unadjusted Monthly Rates.
Natural Gas Prices
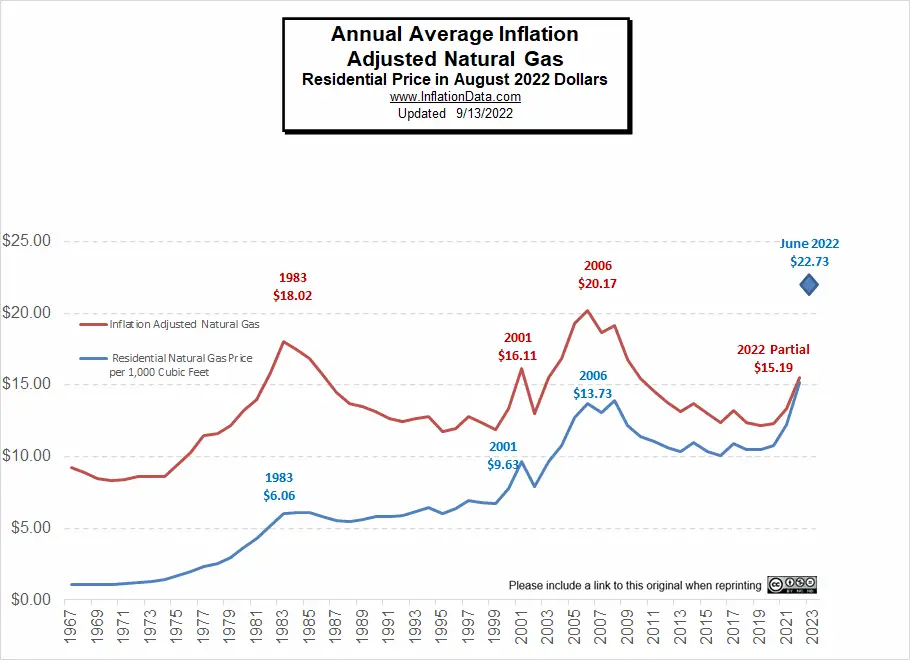
This month we updated our Inflation adjusted natural gas chart. By looking at the Inflation-adjusted natural gas prices we are better able to determine the trend and how prices actually compare to previous times. Speaking of natural gas prices… why are residential natural gas prices so cyclical? And why are they higher when the least amount is being used i.e. in the Summer? For the answer see our article on Inflation Adjusted Natural Gas Prices.
Inflation All Items vs. Core Inflation Chart
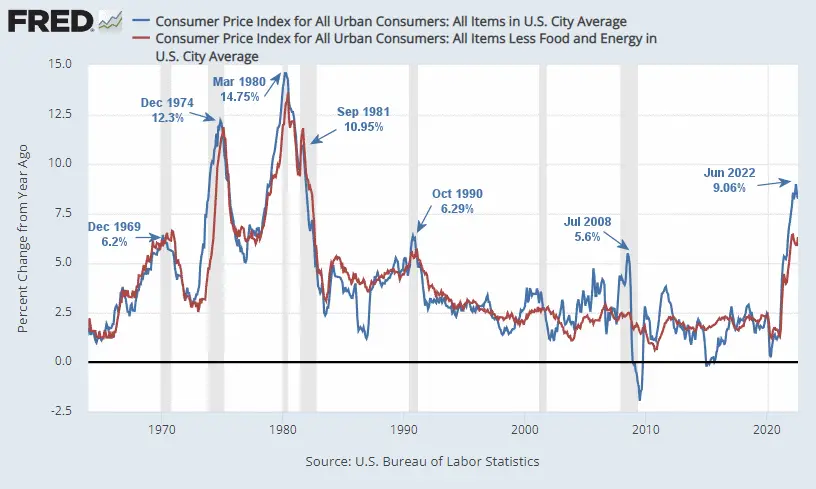
Looking at the chart above from the St. Louis FED, we can see the difference between inflation with food and energy and without. The red line shows the annual inflation rate minus food and energy. Where the blue line is below the red line is generally significant drops in the oil price, like in early 2020 when oil prices went to zero. Previous peaks were 5.60% in July 2008 and 6.29% in October 1990. The last time inflation was higher was in December 1981 when it was 8.92%, but in those days, it had declined from 14.76% in March of 1980.
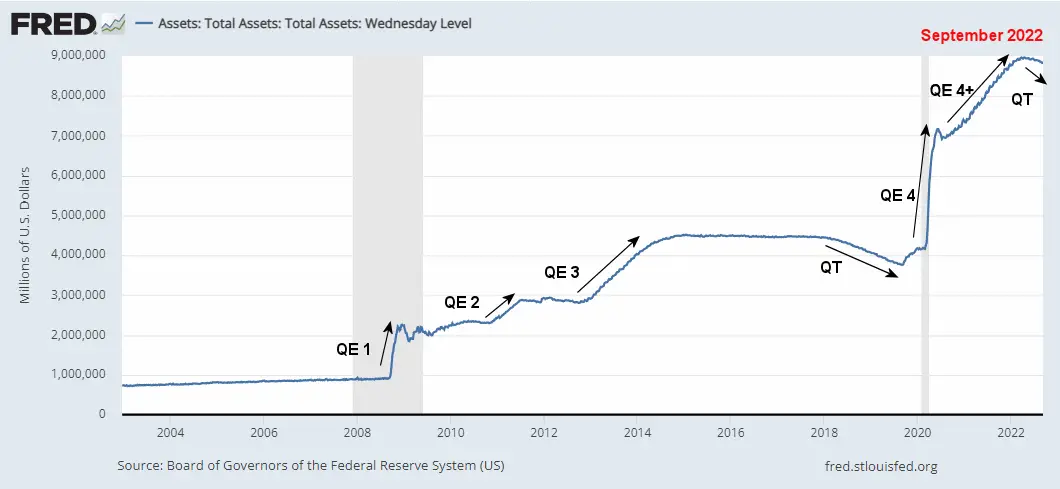
The FED’s total assets have started to level out and even declined a bit, but there is a long way to go to get back to 2019 levels, and that will involve a lot of economic pain, so the question is if the FED will chicken out before it gets there.
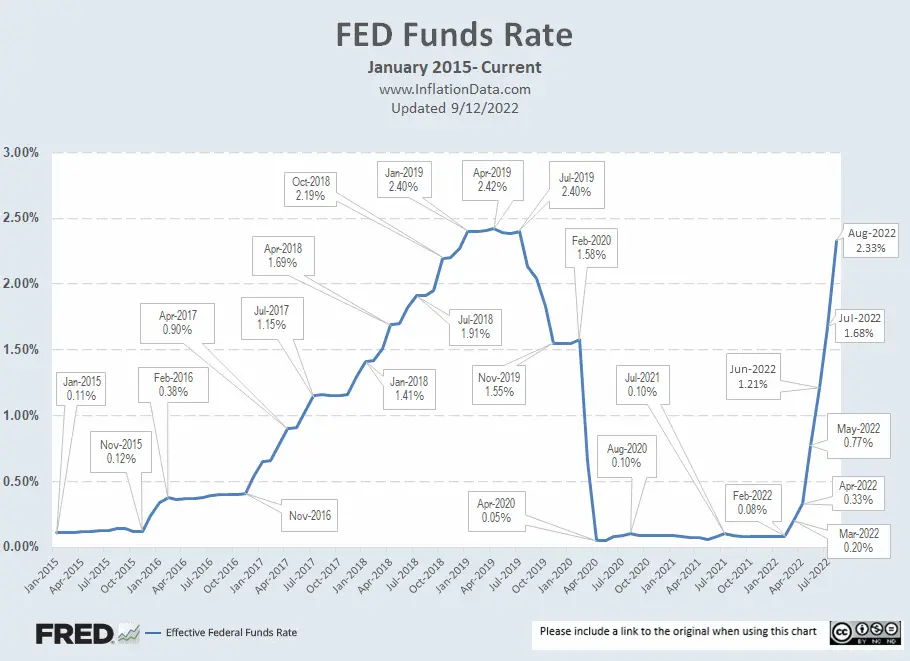
FED Funds Rate
The chart below shows that the FED Funds Rate peaked at around 2.40% from January 2019 through July 2019. Then the FED began fearing that it was holding too tight and the stock market was suffering, so it began easing. It leveled off from November 2019 through January 2020 at 1.55%. In February 2020, the FED raised rates to 1.58%. Then COVID tanked the stock market, and the FED loosened rates to virtually zero (actually 0.05%, i.e., five one-hundredths of a percent. It held relatively steady at that near-zero level until June 2021, when inflation started picking up, so the FED began tentatively raising it very slightly to 1/10th of 1% in July 2021. But it backed off on even that insignificant raise in August. Then from September 2021 to February 2022, the FED held rates steady at 0.08% (virtually zero). In March 2022, it finally acted with a rise to 0.20% and another to 0.33% in April, which is still relatively insignificant in the grand scheme of things, i.e., less than 1/10th of what it was in 2019. And at its peak in 2007, the FED Funds Rate was just over 5 ¼%, so April levels were still ridiculously low.
See: Too Little Too Late for more info. As of August, the FED had raised rates to 2.33% i.e. almost to 2019 levels.
 Although the FED’s announcement sounds aggressive, many commentators don’t believe it is enough to fight inflation. Jeffrey Tucker says, “The Fed’s theory is that it can put out the house fire by carefully spraying a bit of water here and there in a way that doesn’t cause shock and alarm.”
Others are saying to be economically viable short-term interest rates need to be higher than the inflation rate, i.e., investors need to earn a “real rate of return”.
The chart above shows that the FED has raised rates sharply from 0.08% in February to 2.33% in August, bringing levels up almost to 2019 levels. The market is now expecting a monthly increase of .75%, but some people like Scott Buchta at Brean Capital are calling for more i.e. a full 1%. Although I think the FED was late coming to this party, there is no reason for them to go crazy overreacting. The sharp increase combined with lower energy prices seems to be doing the trick.
Chart Data Source St Louis FED.
For more info, See NYSE ROC and MIP.
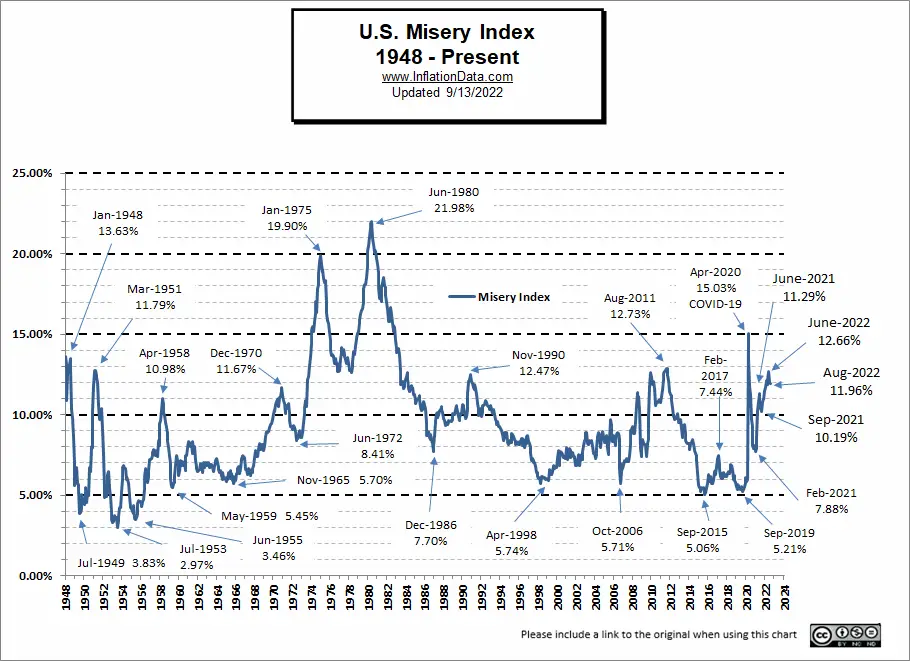
Misery Index
Unemployment was unchanged in April, and Inflation was down slightly, so the Misery index decreased.
| Unemployment | Inflation | Misery Index | |
| January 2022 | 4.0% | 7.48% | 11.48% |
| February 2022 | 3.8% | 7.87% | 11.67% |
| March 2022 | 3.6% | 8.54% | 12.14% |
| April 2022 | 3.6% | 8.26% | 11.86% |
| May 2022 | 3.6% | 8.58% | 12.18% |
| June 2022 | 3.6% | 9.06% | 12.66% |
| July 2022 | 3.5% | 8.52% | 12.02% |
| August 2022 | 3.7% | 8.26% | 11.96% |
[Read More on the Misery Index…]
NYSE Rate of Change (ROC)©

Sell Signal
The NYSE ROC index is still WAY below its moving average.
See the NYSE ROC for more info.
NASDAQ Rate of Change (ROC)©

Sell Signal
The NASDAQ ROC remains well below its moving average too.
See NASDAQ ROC for more.
You Might Also Like:
From InflationData.com
- Everything They Tell You About Inflation is Wrong
- Will Corn Prices Drive Up Inflation?
- Two Ways to Destroy the Economy: Hyperinflation and Central Planning
- Gas Prices Fall, Bringing Down July 2022 Inflation
- Total U.S. Cumulative Inflation
- Have Commodity Prices Peaked? Does That mean Recession?
- 2022: Highest June Inflation Since 1941
- The Many Evils of Inflation
From UnemploymentData.com.
- August: Employment and Labor Force Participation Up
- 6 Steps to Start Your Home-Based Business
- July 2022 Jobs Report- Not as Rosy as They’d Have You Believe
- Is the Average Worker “Falling Behind”?
- 4 Ways to Keep Good Employees at Your Company for Longer
From Financial Trend Forecaster
- NYSE ROC Chart
- NASDAQ ROC Chart
- Non-Fungible Tokens (NFTs): Another Financial “Fumble”
- Will Loan Forgiveness Raise College Costs?
- How Long Will This Recession Last?
- Is The U.S. A Powerful “Empire” In Decline?
- How Low Can the S&P 500 Go?
- France’s War on Terror Uses Eagles to Catch Drones
- The Fed’s New “Tightening” Plan Is Too Little, Too Late
- Keynesians and Market Monetarists Didn’t See Inflation Coming
- Elon Musk Ambushes Twitter
- Can Ruthless Governments Make Crypto Worthless?
From Elliott Wave University
- Stocks Don’t Go Straight Up (or Straight Down)
- What the “Housing Busts” Indicator Is Saying Now
- How to Prepare for a Hard-Hitting Bear Market (Think 1929-1932)
- The Dow 8 Waves are Incomplete
- What to Make of the Stock Market’s Bounce
From OptioMoney
- 7 Ways to Save Money When Living in a Big City
- How Addiction Can Cause Financial Trouble
- Common Mistakes to Avoid When Investing in Real Estate
- Financial Mistakes to Avoid After College
- Common Tax Mistakes That You Need To Avoid
From Your Family Finances
- Prepare For Unexpected Costs When Moving Across State Lines
- Don’t Skip These 4 Key Areas of Healthcare
- How to Stay Within Budget When Building a New House
- Guaranteed Ways to Prepare for a Recession
- How Much Do Dental Implants Cost? How to Save up for Them

Leave a Reply