
After decades of low inflation and even fears of deflation, inflation concerns are once again dominating the headlines in the contemporary financial media.
As the global economy grappled with the fallout of the coronavirus pandemic, major central banks embarked on an unprecedented monetary easing program. This was an attempt to shore up the flagging economic growth by increasing the money supply. This resulted in the shortest recession in economic history but also created problems of its own.
With widespread shortages spooking consumers and investors alike, central banks are now having to contend with persistent supply chain disruptions, decaying consumer confidence, and the looming threat of recession, combined with high inflation risks. Consumers are facing rekindling concerns that the global economy is heading into another cycle of high-priced growth and inflation.
To understand how inflation is changing the game for everything from Taiwanese microchips to Canadian energy stocks, we must look at the broader macroeconomy and the profound impact of the COVID-19 pandemic on the pace of global stimulus.
Inflation and COVID-19
In a general sense, inflation is a monetary and pricing phenomenon that occurs when the money supply exceeds the money demanded. In other words, monetary inflation is the rate of change of the money supply i.e. how fast prices are changing. Inflation is a useful measure of the rate at which the economy’s prices of goods and services are increasing.
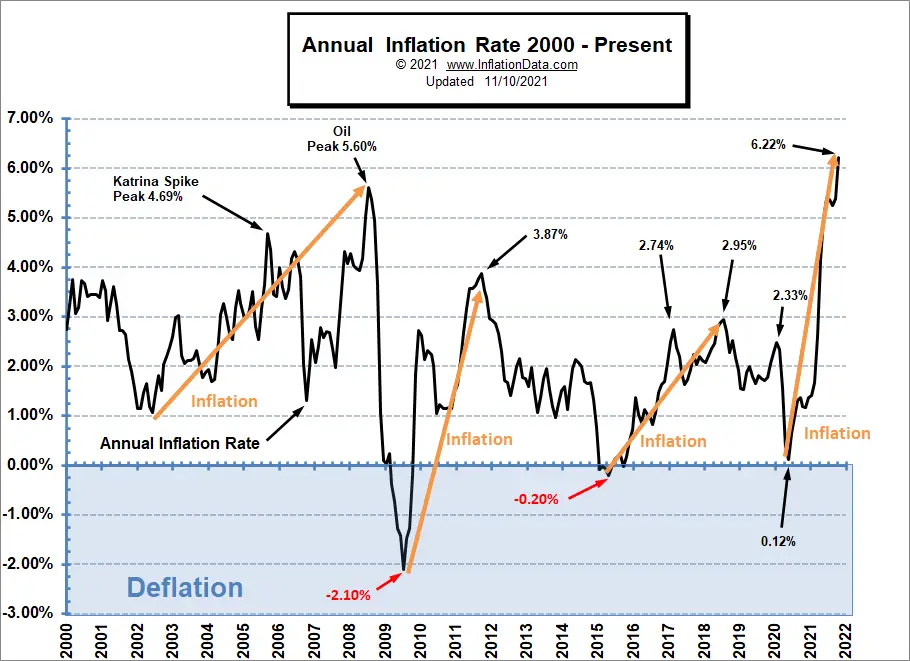
Y2k fears combined with an easy money policy spiked inflation to almost 4% in 2000 but then a recession took inflation back down to 1%. Then from 2002 through 2008, inflation spiked significantly, but the market crash obliterated massive quantities of wealth by simply taking down stock prices. In response, Central Banks worldwide adopted unconventional monetary policies to cushion the fallout of the global financial crisis. This temporarily boosted inflation, taking inflation to 3.87% in 2011. But deflationary forces were still powerful, so by 2016 inflation was non-existent. So the Central Bank again stepped in to create inflation.
Quantitative Easing to Fight Deflation
For the most part, these Central Bank policies came in the form of quantitative easing (QE) — a monetary policy of purchasing government and corporate debt on the secondary market, thereby increasing the money supply in the economy. This policy had the effect of lowering long-term interest rates, and in turn, attracting new investment. But the risks associated with the increased money supply were significant. While this kind of monetary easing spurred lending and supported short-term economic growth, it also fuelled expectations of future inflation. As a result, central banks were forced to undertake a cycle of repeated rate hikes to bring inflation back under control.
With the lack of massive deflationary forces in the current cycle, the impact of monetary easing is being felt more directly. In response to the economic shock caused by the COVID-19 pandemic, central banks around the world began pumping unprecedented amounts of money into their balance sheets, injecting some $10.4 trillion into the global economy via QE and other liquidity programs.
Market Forces
We know that rising monetary inflation can underpin increases in consumer costs, but what are the implications of this trend on specific sectors of the economy. In a worst-case scenario, we could see a replay of the 1970s where massive inflation did not boost economic growth. Instead, the economy suffered from the worst possible scenario with a stagnant economy plus massive inflation, i.e., stagflation.
As the prices of oil and other commodities continue to skyrocket, commodity analysts have been pondering the implications of rising inflation amid the strong performance of the oil and gas industry and how the two sectors are connected in the broader market. While the nature of QE makes it difficult to draw any hard and fast conclusions, we have highlighted three factors that are propelling upward movement across different sectors of the economy.
- Boosting Market Confidence
For both investors and public companies, inflation is viewed as a manageable risk so long as central banks can wind down their stimulus plans before inflation gets out of hand. At the same time, dedicated liquidity injection programs like QE combined with low-interest rates provide a floor under the market and guarantee market confidence. The ongoing stimulus programs are boosting investor confidence, and market participants are now betting on a long-term rebound in the global economy.
- Encouraging Speculative Activity
Rising inflation generally has an inverse relationship with interest rates. By suppressing possible returns on savings accounts, treasury, and corporate bonds, and deposit certificates, QE encourages investors to seek higher potential returns in the form of stock market gains. When coupled with cash stimulus checks, the net effect is surging demand in equities and commodities.
- Lower Borrowing Costs
Lower interest rates can mean lower borrowing costs for public companies while maintaining a solid stock market valuation. Companies with robust balance sheets can improve their value proposition by using the extra cash to fund shareholder buybacks, expand acquisitions, or even buy back outstanding shares on the open market.
Key Takeaways
In short, rising inflation is a force to reckon with — and it’s here to stay. For now, the stimulative effects of global QE programs are providing a temporary reprieve from the long-run impacts of COVID-19. Still, these favorable tailwinds are likely to decrease in the near future. Central banks must, therefore, carefully manage monetary policy to prevent inflation from spiraling out of control.
Ultimately, while inflation’s impact on the broader market will vary based on the composition of different sectors and the overall macroeconomic outlook, investors may want to re-examine their allocation strategies to account for a potentially more volatile short to the mid-term market environment.
You might also like:

Leave a Reply