According to the Bureau of Labor Statistics CPI report released on August 10th, Annual Inflation increased from 3% in June to 3.2% in July.
(but more precisely, it was from 2.97% to 3.18%.)
Monthly inflation was 0.25% for May 2023, 0.32% in June, and 0.19% in July.
July 2023 Inflation Summary:
- Annual Inflation rose from 2.97% to 3.18%
- CPI Index rose from 305.109 to 305.691
- Monthly Inflation for July was 0.19%, down from 0.32% in June
- Next release is September 13th, 2023
| Jan | Feb | Mar | Apr | May | June | July | Aug | Sep | Oct | Nov | Dec | |
| 2022 | 7.48% | 7.87% | 8.54% | 8.26% | 8.58% | 9.06% | 8.52% | 8.26% | 8.20% | 7.75% | 7.11% | 6.45% |
| 2023 | 6.41% | 6.04% | 4.98% | 4.93% | 4.05% | 2.97% | 3.18% |
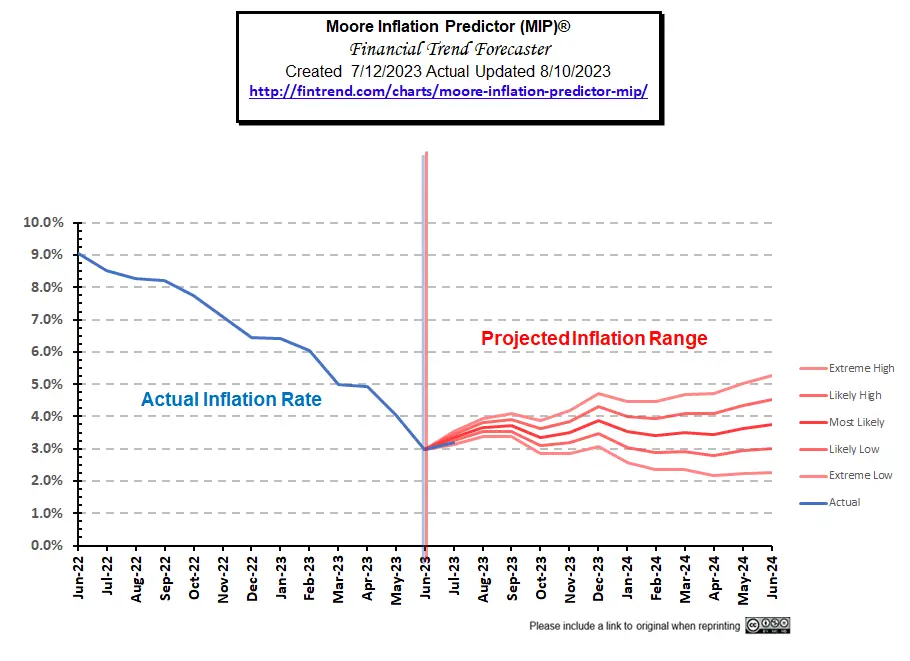
As you can see, the actual rate for July was at the low end of our projection, indicating that this is really a fairly good outcome.
Moore Inflation Predictor
 BLS Commentary:
The BLS Commissioner reported: “The Consumer Price Index for All Urban Consumers (CPI-U) rose 0.2 percent in July on a seasonally
adjusted basis, the same increase as in June, the U.S. Bureau of Labor Statistics reported today.
Over the last 12 months, the all items index increased 3.2 percent before seasonal adjustment.
The index for shelter was by far the largest contributor to the monthly all items increase,
accounting for over 90 percent of the increase, with the index for motor vehicle insurance also
contributing. The food index increased 0.2 percent in July after increasing 0.1 percent the previous
month. The index for food at home increased 0.3 percent over the month while the index for food away
from home rose 0.2 percent in July. The energy index rose 0.1 percent in July as the major energy
component indexes were mixed.”
He is saying that on a “seasonally adjusted” basis June and July were the same but on a NON-adjusted basis June was 0.32% and July was 0.19%.
They continue to harp on Shelter as it is a large percentage of the index and it was up 7.7% for the year but…
Transportation Services was up 9% for the year and
Food away from home was up 7.1% for the year.
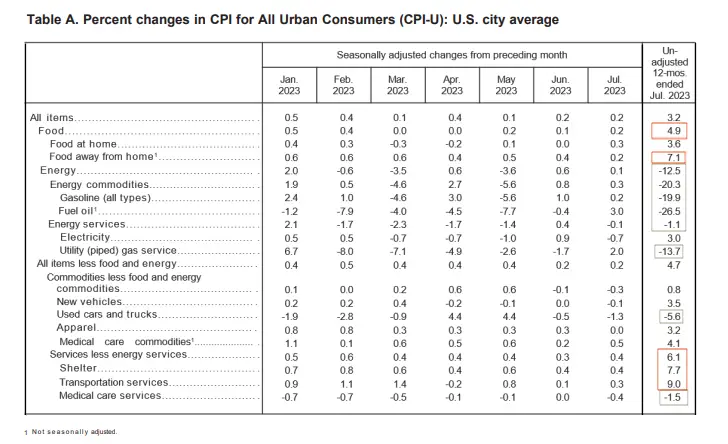
Although these “Seasonally Adjusted” numbers are slightly different than those presented by the BLS, the following chart from the Federal Reserve shows the gap between inflation with and without Food and Energy. So we can see how much food and energy are contributing toward overall inflation. If the blue line is above the red line, “food and energy” are adding to the overall inflation rate. But if blue is below red, they are actually mitigating overall inflation. Looking at the red line, we can see that without the downward pressure of Energy prices, inflation would be 1.4% higher. Actually, only energy is pulling inflation down, food is actually up 4.9% since last year. So, without energy but with food, the red line would be even higher.
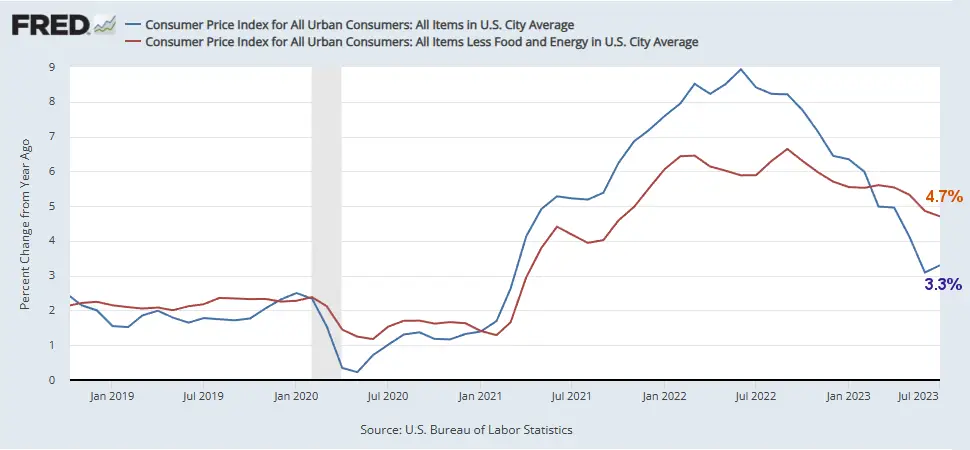
Source: St. Louis FED
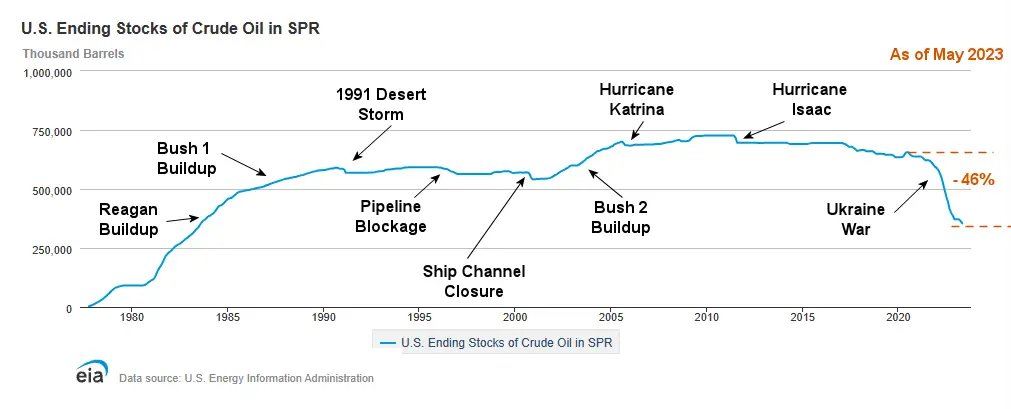
And as we’ve been saying for a while now, energy has been a major factor in bringing down annual inflation because Biden has been depleting the Strategic Petroleum Reserves drastically over the last year. But at some point, they are going to have to replace those reserves (perhaps at much higher prices).
Note: Reserves would have started at much higher levels had Democrats not refused Trump’s request to increase reserves when oil was super cheap.
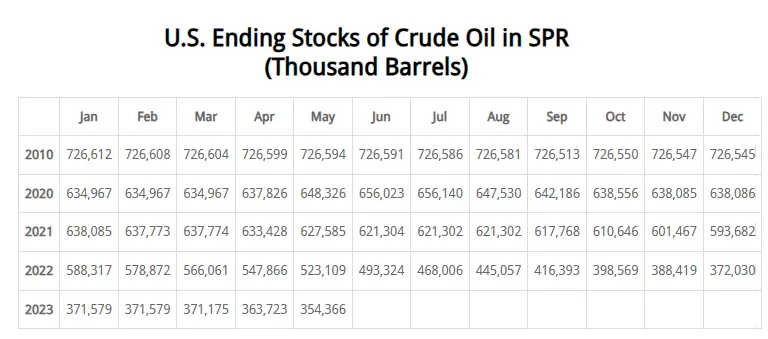
In this chart from the U.S. EIA, we can see the extent of the recent strategic petroleum reserve drawdown compared to those of Desert Storm, various hurricanes, and other supply disruptions. The recent draw-down dwarfs all of the others combined. Unfortunately, the E.I.A. is always a couple of months behind in updating its chart. As of May (the most recent data available), the SPR has been drawn down -45.99% since 2020 and even more since 2010. According to the data, the SPR stood at 656,140,000 barrels in July of 2020. By March 2023, it was down to 371,175,000, and in April, it had fallen to 363,723,000. It May it was 354,366,000.
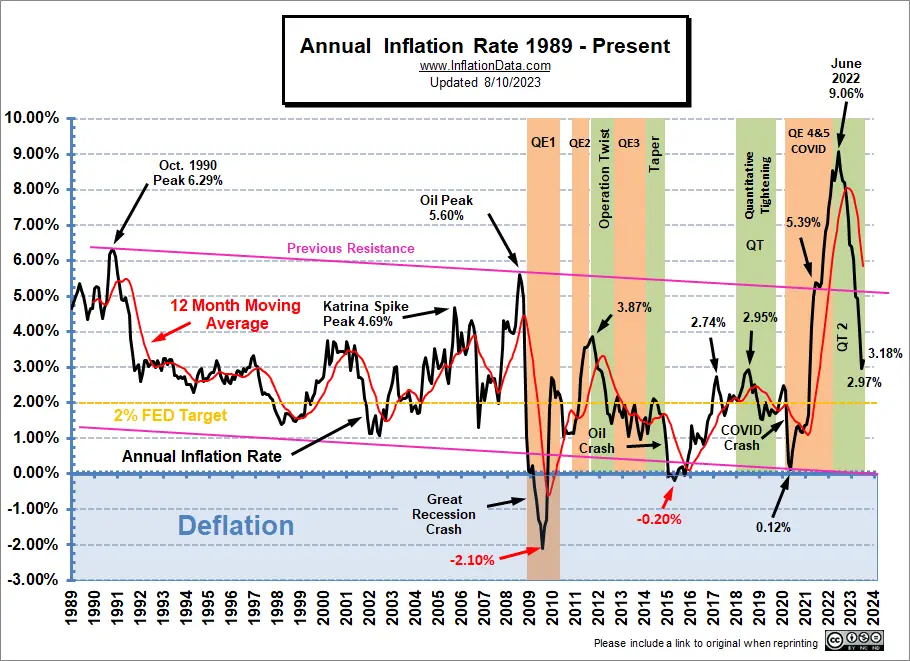
Inflation Chart since 1989
Beginning in 1989, the longer-term trend was downward until 2021.
(Note the declining “previous resistance” line.) But… Early in 2021, inflation started spiking and quickly broke through the channel’s top and then exceeded the pink previous resistance line with barely a hiccup as it passed through. Now inflation has crossed back down into that channel (with April generating the hiccup this time). The current upmove is more technical than systemic so it shouldn’t be a major problem but depending on gasoline/oil prices we could see inflation in the 3% to 4% range over the next year.
FED Actions
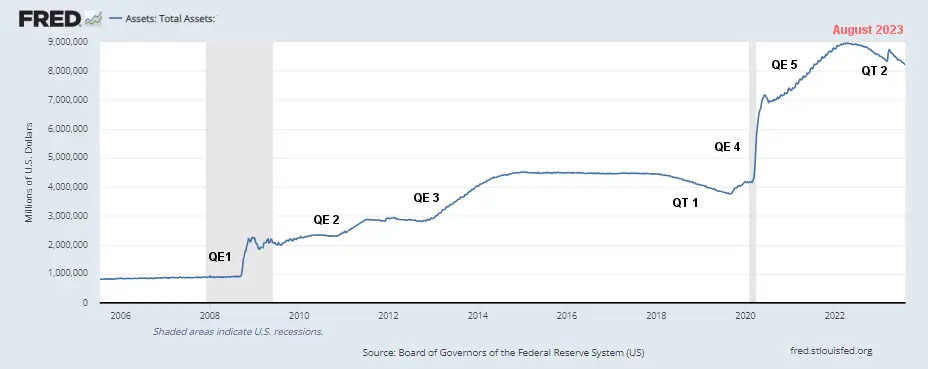
For two years, we said FED assets would go to $9 Trillion… and they almost got there. Then finally, the FED got its act together and started tightening, resulting in roughly a 2/3 Trillion decrease (QT2). But then a banking crisis broke out in California, and the FED jumped it back up, wiping out roughly 38% of the gains they made. Since then, the FED has been decreasing assets again, reducing it to below the level prior to the bank scare.
See more commentary on FED Actions here, here, and here.
Monthly Inflation Compared to Previous Years:
In the chart below, we can see how the monthly inflation compares between 2019 (light green), 2020 (light blue), 2021 (pink), 2022 (red), and 2023 (orange). We can see that virtually every month in 2021 was above the corresponding month in 2020, but in 2022, April and July-December were below 2021’s level.
In 2023 so far, January and April were only slightly lower than in 2022, February was considerably lower than in 2022, and March, May and June were massively lower than in 2022. With July 2022 at virtually zero the ).19% for 2023 raised annual rates and with August being negative we expect August 2023 to be higher again. Then the rest of the year could also be very disappointing for those expecting lower inflation.
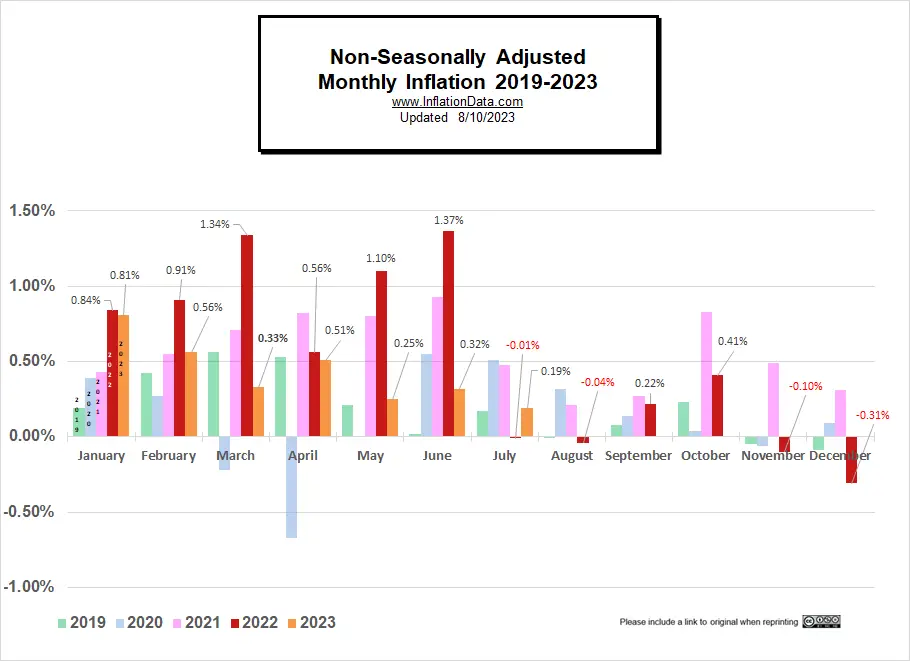
Not Seasonally Adjusted Monthly Inflation Rates
Note: January 2022’s 0.84% was the highest January since 1990. June was the highest June since 1941 (although the first quarter of 1980 had some higher rates). Typically, June is the beginning of lower monthly rates.
| Jan | Feb | Mar | Apr | May | Jun | Jul | Aug | Sep | Oct | Nov | Dec | |
| 2016 | 0.17% | 0.08% | 0.43% | 0.47% | 0.41% | 0.33% | (0.16%) | 0.09% | 0.24% | 0.12% | (0.16%) | 0.03% |
| 2017 | 0.58% | 0.31% | 0.08% | 0.30% | 0.09% | 0.09% | (0.07%) | 0.30% | 0.53% | (0.06%) | 0.002% | (0.06%) |
| 2018 | 0.54% | 0.45% | 0.23% | 0.40% | 0.42% | 0.16% | 0.01% | 0.06% | 0.12% | 0.18% | (0.33%) | (0.32%) |
| 2019 | 0.19% | 0.42% | 0.56% | 0.53% | 0.21% | 0.02% | 0.17% | (0.01%) | 0.08% | 0.23% | (0.05%) | (0.09%) |
| 2020 | 0.39% | 0.27% | (0.22%) | (0.67%) | 0.002% | 0.55% | 0.51% | 0.32% | 0.14% | 0.04% | (0.06%) | 0.09% |
| 2021 | 0.43% | 0.55% | 0.71% | 0.82% | 0.80% | 0.93% | 0.48% | 0.21% | 0.27% | 0.83% | 0.49% | 0.31% |
| 2022 | 0.84% | 0.91% | 1.34% | 0.56% | 1.10% | 1.37% | (0.01%) | (0.04%) | 0.22% | 0.41% | (0.10%) | (0.34%) |
| 2023 | 0.80% | 0.56% | 0.33% | 0.51% | 0.25% | 0.32% | 0.19% |
See: Monthly Inflation Rate for more information and a complete table of Unadjusted Monthly Rates.
Misery Index
Unemployment was down slightly, and with Inflation’s increase, the Misery Index rose from 6.57% to 6.68%.
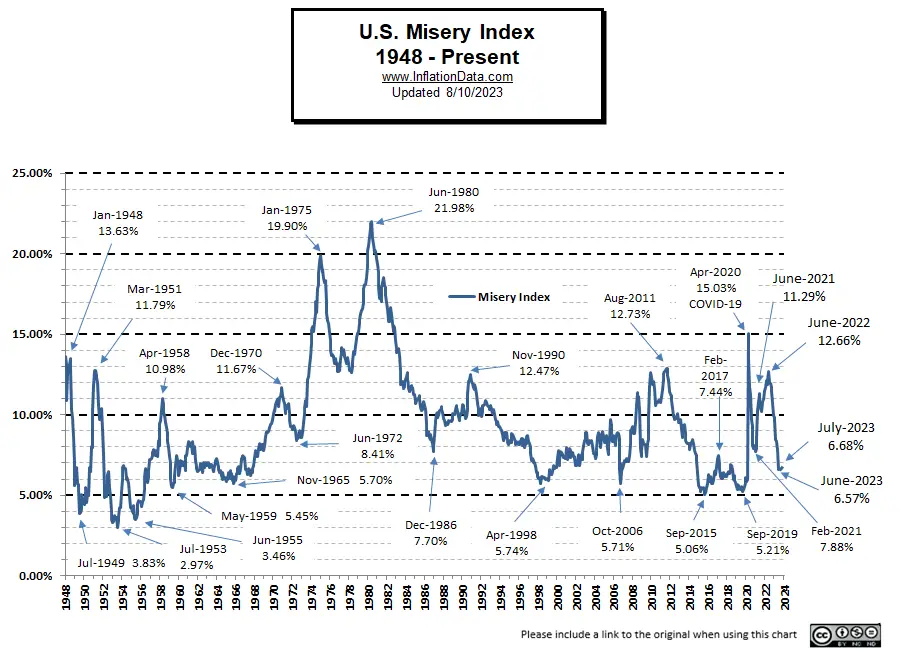
[Read More on the Misery Index…]
NYSE Rate of Change (ROC)
In February 2023, the NYSE- ROC crossed back above its 12-month moving average, generating a BUY Signal…
Then we received confirmation that the signal was real in that the index had crossed back above the zero line. So far, the market has only taken a minor break for the Summer. But at this point, it certainly looks like the market is recovering.
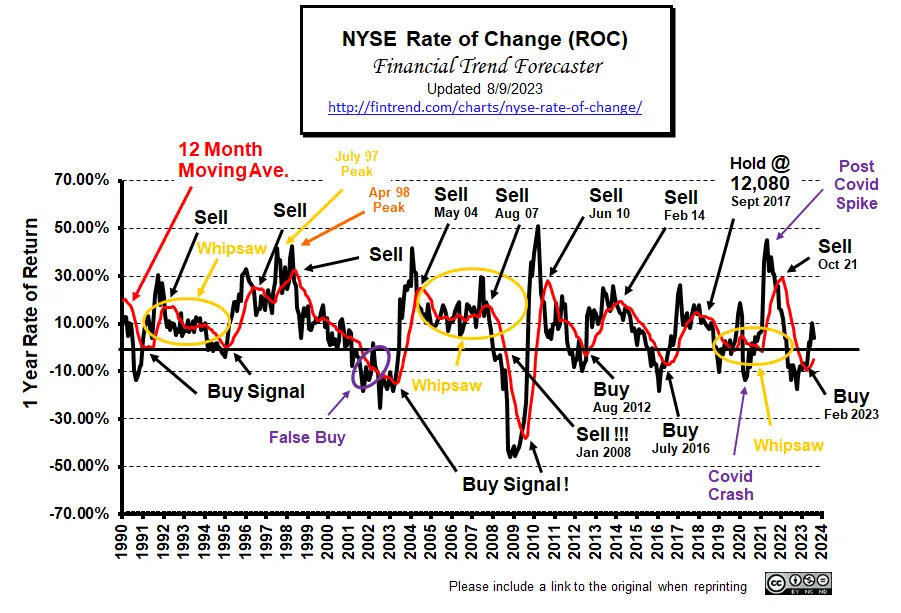
For more information, see NYSE Rate of Change (ROC) and NASDAQ ROC Chart.
You Might Also Like:
From InflationData.com
- Do Private Corporations Cause Inflation?
- No Surprise… FED Raised Rate by 1/4%
- How Inflation Impacts Merchants
- What is the Difference between the CPI-U and the CPI-W
- June 2023- Inflation Falls to 3%
- Radical Decentralization: the Key to Wealth and Freedom
- The Effects of Raising the Debt Ceiling
- Default by Inflation
- Is There an Optimum Growth Rate of Money?
- Can the Dollar Retain Its Ultimate Currency Status?”
- What are “Sticky Prices” and Why Do They Matter?
From Financial Trend Forecaster
- NYSE ROC Chart
- NASDAQ ROC Chart
- Deepest Yield Curve Inversion Since 1981
- Is this the End of Fractional Reserve Banking?
- A Guide to Good Money
- Does Science Shape Economic Progress?
- There is No Such Thing as a “Natural” Monopoly
From UnemploymentData.com.
- July 2023 Unemployment Down
- Things to Look for When Locating Your Business
- June 2023 Employment at All-Time High
- What to Do When Your A/C Gives Out at Work
- Construction Consultants: What Are They and How to Work With Them
- Yet Another Month of Questionable Federal Jobs Data as 310,000 Fewer People Report Having Jobs
From Elliott Wave University
- Quick Takes on Big Financial Trends
- Extremely Rare Market Signal Just Triggered
- Stocks and Junk Bonds: “This Divergence Appears Meaningful”
- Where is the Market Headed in May 2023
- Is a Pension Fund Crisis Next?
- Corporate Bonds: “The Next Shoe to Drop”?
From OptioMoney
- The Art of DIY: Saving Money by Learning New Skills
- Smart Ways to Save Money on Everyday Expenses
- Simple Ways to Improve Your Relationship with Money
- Smart Ways to Avoid Financial FOMO
- How Buying a House Affects Your Finances
From Your Family Finances
- How to Maximize Savings… Without Sacrificing Lifestyle
- Making Your Kido an Investment Genius
- 10 Tips to Prepare for Your Financial Future
- Protect Your Home with Home Insurance
- 6 Keys to Saving for Major Family Milestones


You use the bait of “But it also warns that next month will be a surprise in the other direction!” to read the entire article but never give the answer.
That line appeared on our June post not July, when everyone was expecting lower inflation. As we predicted July came in higher as did August.
July 2023 inflation was 3.18% up from 2.97% in June.
August 2023 Inflation was 3.67%.
You can always view our Moore Inflation Projections (MIP) here:
https://fintrend.com/charts/moore-inflation-predictor-mip/
Hope this clears things up.