
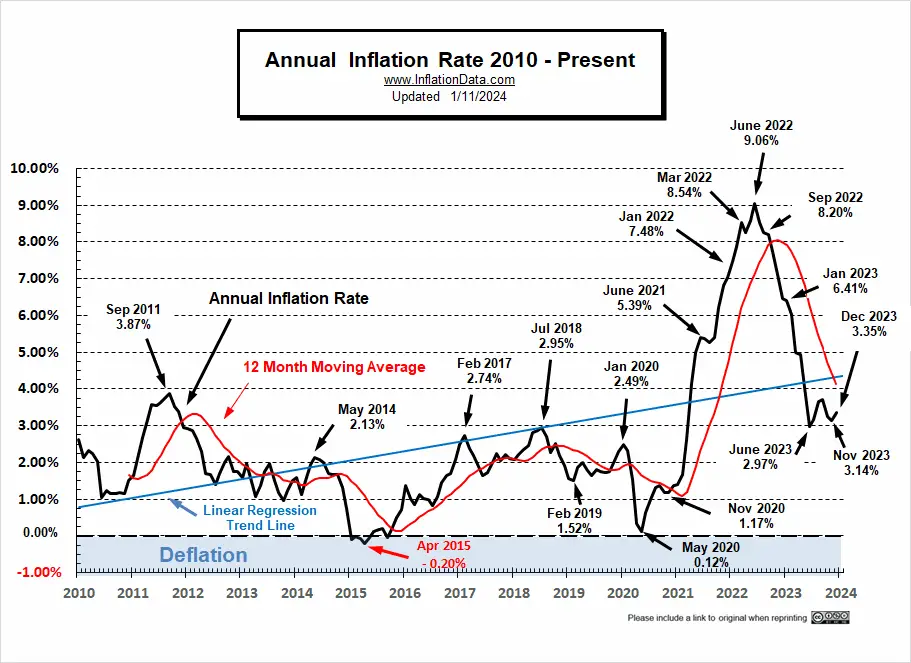
According to the Bureau of Labor Statistics CPI report released on January 11th, Annual Inflation was up to 3.4% in December from 3.1% in November.
(but since we calculate it to two digits, it was actually 3.35%.)
Monthly inflation was -0.04% in October, -0.20% in November, and -0.10% in December, But inflation is almost always low to negative in the fourth quarter of the year, so these numbers are not unusual. The BLS’s Seasonally adjusted monthly rate for December was actually a positive 0.30% indicating that even though unadjusted was negative, it was not as negative as usual (making the adjusted numbers higher).
The stock market was expecting another decline in inflation like last month, so they were mildly disappointed, but the market was able to eke out a point or two of gains. We had been projecting a rise for December and we hit the nail precisely on the head with our most likely number.
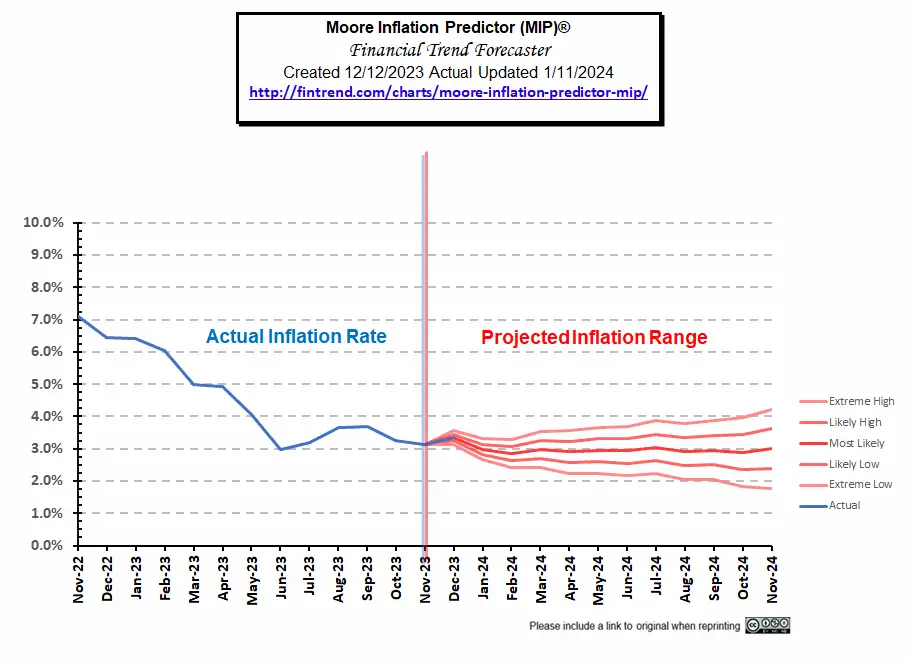 Go here to view our current MIP projection.
December 2023 Inflation Summary:
- Annual Inflation rose from 3.14% to 3.35%
- CPI Index fell from 307.051 to 306.746 (below August’s 307.026)
- Monthly Inflation for December was -0.10%
- Next release February 13th 2024
| Jan | Feb | Mar | Apr | May | June | July | Aug | Sep | Oct | Nov | Dec | |
| 2022 | 7.48% | 7.87% | 8.54% | 8.26% | 8.58% | 9.06% | 8.52% | 8.26% | 8.20% | 7.75% | 7.11% | 6.45% |
| 2023 | 6.41% | 6.04% | 4.98% | 4.93% | 4.05% | 2.97% | 3.18% | 3.67% | 3.70% | 3.24% | 3.14% | 3.35% |
BLS Commentary:
The BLS Commissioner reported:
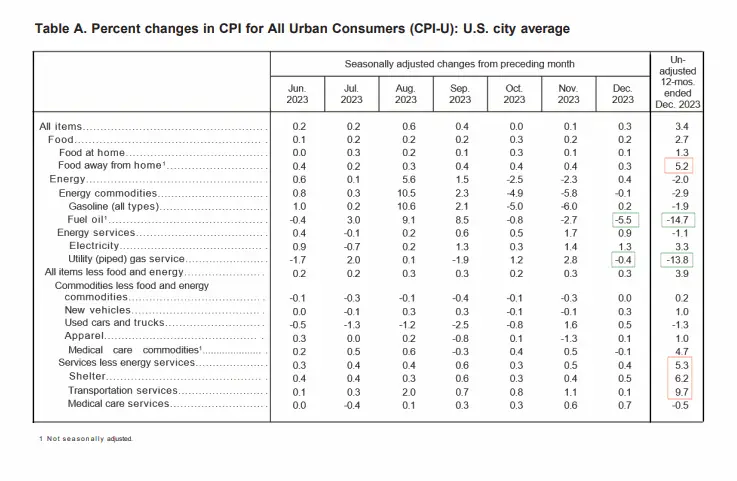
The Consumer Price Index for All Urban Consumers (CPI-U) increased 0.3 percent in December on a seasonally adjusted basis, after rising 0.1 percent in November, the U.S. Bureau of Labor Statistics reported today. Over the last 12 months, the all items index increased 3.4 percent before seasonal adjustment.
The index for shelter continued to rise in December, contributing over half of the monthly all items increase. The energy index rose 0.4 percent over the month as increases in the electricity index and the gasoline index more than offset a decrease in the natural gas index. The food index increased 0.2 percent in December, as it did in November. The index for food at home increased 0.1 percent over the month and the index for food away from home rose 0.3 percent.
Although, monthly inflation rose 0.3% on a seasonally adjusted basis on a non-adjusted basis they fell -0.10%.
As we can see from the chart below, once again declining Energy prices helped to pull down the overall index while services are still rising keeping inflation high.
Although these “Seasonally Adjusted” numbers are slightly different than those presented by the BLS, the following chart from the Federal Reserve shows the gap between inflation with and without Food and Energy. Comparing the two we can see how much food and energy are contributing toward overall inflation.
If the blue line is above the red line, food and energy, are adding to the overall inflation rate. But if blue is below the red line, they are actually mitigating overall inflation. As the blue line rose toward the red line from June through August, we noted that energy was doing less to keep down overall inflation. This month the red line is still inflating at 3.9%. So, is inflation 3.3% or 3.9%? When energy is dragging inflation up, the gov’t wants to use the numbers excluding food and energy… but now they are happy to ignore the red line.
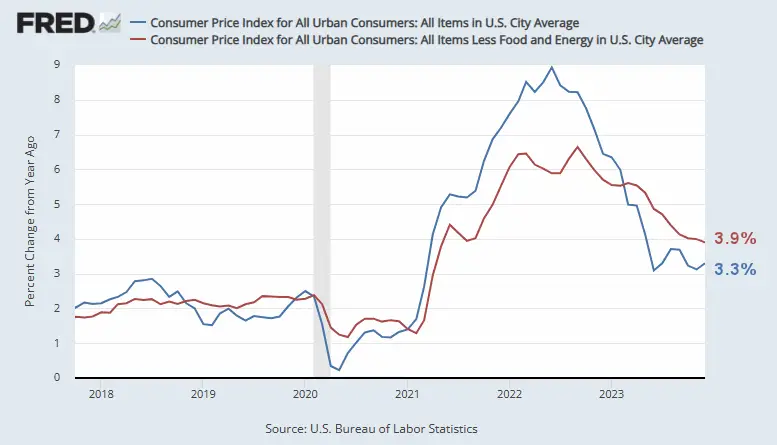
Source: St. Louis FED
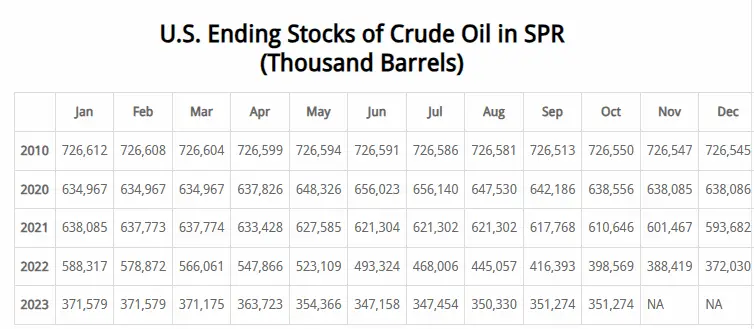
Overall energy prices have been down over the last year because the government has been flooding the market with cheap oil by depleting our strategic petroleum reserves. But at some point, they are going to have to replace those reserves (perhaps at much higher prices). Note: Reserves would have started at much higher levels had Democrats not refused Trump’s request to increase reserves when oil was cheap.
This chart from the U.S. EIA shows the extent of the recent strategic petroleum reserve drawdown compared to those of Desert Storm, various hurricanes, and other supply disruptions. Unfortunately, the E.I.A. is always a couple of months behind in updating its chart. But with the data we have we can see that the recent draw-down dwarfs all of the others combined. In July 2020, the SPR stood at 656,140,000 barrels.
As of June 2023, the SPR was down to 347,158,000 or roughly -47.1% below July 2020 levels, which were already below 2010 levels. From January to February, levels were unchanged, so we were hoping that they had halted the drawdown, but drawdowns continued through June. By September there was a slight increase to 351,274,000 where it remained in October (the most recent data available). This reduces the drawdown slightly (almost imperceptible on the tail end of the chart).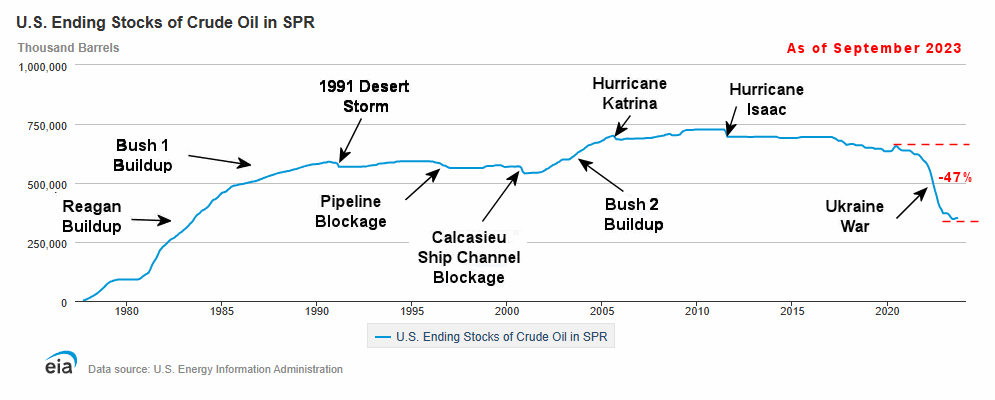
Inflation Chart
Monthly Inflation Compared to Previous Years:
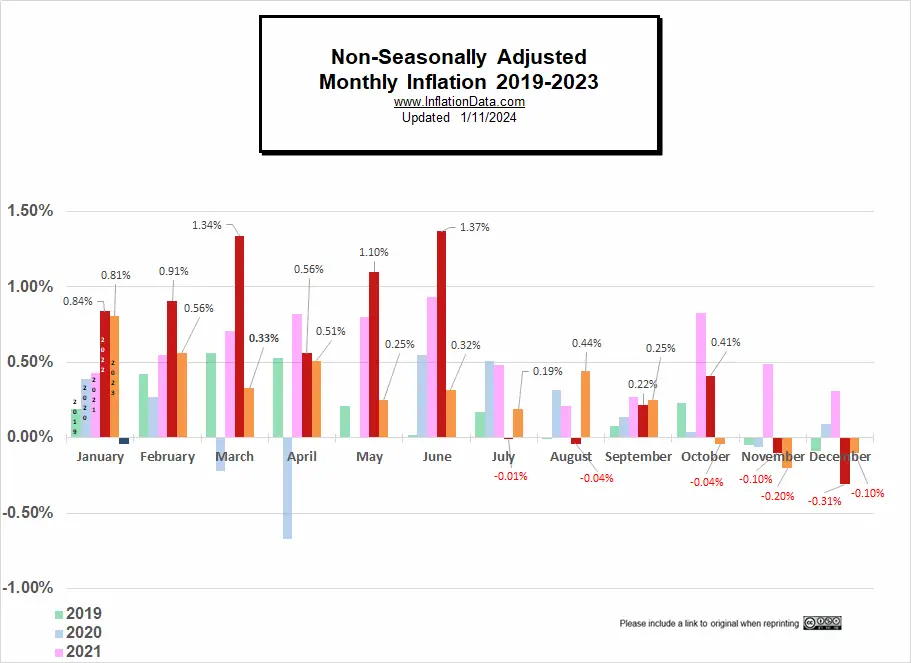
The monthly inflation rate for December 2023 was -0.10%
In the chart below, we can see how the monthly inflation compares between 2019 (light green), 2020 (light blue), 2021 (pink), 2022 (red), and 2023 (orange). 2022 started out with very high monthly inflation 0.84% (January), 0.91% (February), and 1.34% (March) even for the first quarter of a year when monthly inflation is already at its highest. Typically, monthly inflation is highest from January through May, often in the 0.30% to 0.50% range and low to negative in the fourth quarter of the year.
We can see that December 2022 was -0.31% while December 2023 was -0.10% causing annual inflation to rise from 3.14% to 3.35%
Not Seasonally Adjusted Monthly Inflation Rates
Note: January 2022’s 0.84% was the highest January since 1990. June was the highest June since 1941 (although the first quarter of 1980 had some higher rates). Typically, June is the beginning of lower monthly rates.
| Jan | Feb | Mar | Apr | May | Jun | Jul | Aug | Sep | Oct | Nov | Dec | |
| 2016 | 0.17% | 0.08% | 0.43% | 0.47% | 0.41% | 0.33% | (0.16%) | 0.09% | 0.24% | 0.12% | (0.16%) | 0.03% |
| 2017 | 0.58% | 0.31% | 0.08% | 0.30% | 0.09% | 0.09% | (0.07%) | 0.30% | 0.53% | (0.06%) | 0.002% | (0.06%) |
| 2018 | 0.54% | 0.45% | 0.23% | 0.40% | 0.42% | 0.16% | 0.01% | 0.06% | 0.12% | 0.18% | (0.33%) | (0.32%) |
| 2019 | 0.19% | 0.42% | 0.56% | 0.53% | 0.21% | 0.02% | 0.17% | (0.01%) | 0.08% | 0.23% | (0.05%) | (0.09%) |
| 2020 | 0.39% | 0.27% | (0.22%) | (0.67%) | 0.002% | 0.55% | 0.51% | 0.32% | 0.14% | 0.04% | (0.06%) | 0.09% |
| 2021 | 0.43% | 0.55% | 0.71% | 0.82% | 0.80% | 0.93% | 0.48% | 0.21% | 0.27% | 0.83% | 0.49% | 0.31% |
| 2022 | 0.84% | 0.91% | 1.34% | 0.56% | 1.10% | 1.37% | (0.01%) | (0.04%) | 0.22% | 0.41% | (0.10%) | (0.34%) |
| 2023 | 0.80% | 0.56% | 0.33% | 0.51% | 0.25% | 0.32% | 0.19% | 0.44% | 0.25% | (0.04%) | (0.20%) | (0.10%) |
See: Monthly Inflation Rate for more information and a complete table of Unadjusted Monthly Rates.
Misery Index
Current Misery Index: Unemployment 3.7% + Inflation 3.35% = 7.05%
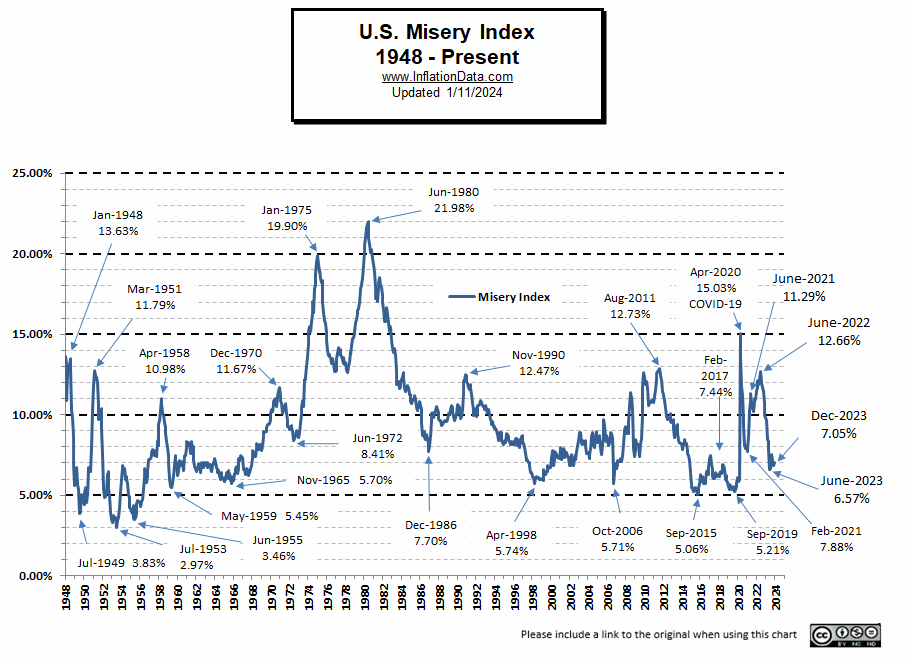
[Read More on the Misery Index…]
NASDAQ Rate of Change (ROC)
The NASDAQ is roaring ahead with a 35% move above year-ago levels.
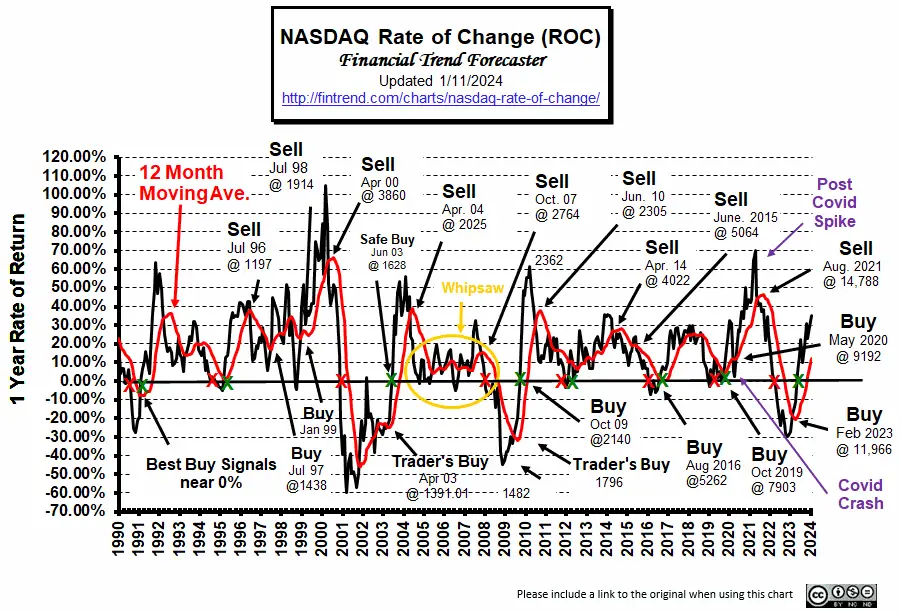
For more information, see NYSE Rate of Change (ROC) and NASDAQ ROC Chart.
You Might Also Like:
From InflationData.com
- Not All Prices Have Inflated Since 1964
- Worldwide Inflation by Country in 2023
- Does Inflation Increase Economic Output?
- Inflation Adjusted Mortgage Rates
- The Source of the Eurozone’s Economic Woes
- The Great Phony Disinflation
From Financial Trend Forecaster
- Moore Inflation Predictor
- NYSE ROC
- NASDAQ ROC Chart.
- America’s Fiat Money Gestapo: The Untold History of the Secret Service
- Argentina Mulls Dollarization- What is it?
- The Fed Is Draining Our Economy Like Farmers Have Drained Their Aquifers
- If the Economy Is So Great, Why Are Tax Revenues So Weak?
From UnemploymentData.com.
- How to Make a Living as a Sound Engineer
- December Unemployment Unchanged
- Conquer the Skies and Stand Out as an Aviation Medical Examiner
- 10 Job Hazards Everyone Should Watch Out For No Matter Their Industry
- 5 Powerful Ways to Find Your Next Job Online
From Elliott Wave University
- Update on China’s Big Housing Bust
- Mini-Manias: Beware Short-Term Trading Frenzies – Like This One
- Why You Should Expect a Once-in-a-Lifetime Debt Crisis
- Why Do Traders Really Lose Money?
- Quick Takes on Big Financial Trends
From OptioMoney
- Financial Factors to Consider When Relocating Your Business
- Nomad Living: Managing Finances for a Mobile Lifestyle
- Financial Resilience in Uncertain Times
- Moving Abroad on a Budget:
From Your Family Finances
- Estate Planning: How to Prevent Family Arguments over Your Assets
- Tips for Adapting Your Budget to Urban or Rural Living After Moving
- Why Leasing is a Giant Rip-Off (and When it’s Not)
- Keep Your Home Trash-Free with these 5 Easy Habits
- Thriving on a Single Income

Leave a Reply