
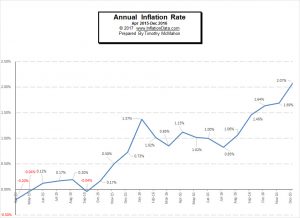
Annual Inflation is up from 2.07% in December to 2.5% in January. January itself racked up a whopping 0.58% monthly inflation rate. The Bureau of Labor Statistics released the newest inflation numbers on for January on February 15th 2017. Their Consumer Price Index (CPI-U) for all Urban Consumers was 242.839 up from 241.432 in December. Annual Inflation Chart Annual inflation is up from the annual cyclical low of 0.84% in July 2016, August was 1.06%, September rose to 1.46% and October was 1.64%. This is also up from the longer term cyclical low of -0.20% in April of 2015. Although this may look like the beginning of a longer upward trend it is still possible that it is simply a … [Read more...]
December Inflation Rate Finally Tops 2%
For quite some time, I've been saying, that "annual inflation throughout 2016 would remain well below the official FED target of 2% but we are getting closer and it is possible that December could tip the scale above 2%." And that is exactly what happened... annual inflation finished the year at 2.07%! The Bureau of Labor Statistics (BLS) released the data for the month of December on January 18th. They also adjusted four months of data from May through August 2016 due to some faulty data relating to Prescription drug prices but it had no visible effect on the published inflation rates and was only visible if you extended the calculation out to 3 decimal places. Annual Inflation … [Read more...]
November Inflation Up Slightly
The U.S. Bureau of Labor Statistics (BLS) released the monthly and annual inflation rate data for November 2016 on December 15th. The next data release is scheduled for January 15th. The current annual inflation rate is 1.69% up from 1.64% in October. Monthly inflation was actually negative for November but "less negative" than in 2015 causing the Annual Inflation rate to rise. Inflation for the month of November 2016 was -0.16%, while November 2015 was -0.21%. The CPI index was 241.353 in November 2016 down from 241.729 in October. Current Annual Inflation Chart Annual inflation for the 12 months ending in November 2016 was 1.69% up from a cyclical low of 0.84% in July. August was … [Read more...]
Inflation Climbs Again in October

The U.S. Bureau of Labor Statistics (BLS) released the monthly and annual inflation rate data for October 2016 on November 17th. The current annual inflation rate is 1.64% up from 1.46% in September. Monthly inflation was 0.12% for the month of October 2016, while October 2015 was -0.14%. meaning that as the negative number fell out of the calculation and was replaced by a positive one, annual inflation jumped up. Historically, the 4th quarter, i.e. October, November and December have been negative inflation months i.e. disinflationary. So having positive inflation for the month of October is a bit unusual and could indicate a trend toward rising inflation or it could simply be the … [Read more...]
Annual Inflation Up Slightly in August
The U.S. Bureau of Labor Statistics (BLS) released their monthly inflation report for August on September 16th. According to the BLS Annual Inflation rose from 0.84% in July to 1.06% in August bringing inflation back in line with the levels in April through June. Inflation was 1.13% in April, 1.02% in May, and 1.01% in June. However, the rise was not due to high monthly inflation. Monthly inflation was only 0.09% for August 2016. Rather annual inflation rose because August 2015's -0.14% fell out of the equation. Interestingly, if last month's monthly inflation of -0.16% .was swapped with this month's 0.09% the Annual Inflation rate would have been much more stable. The rate would look … [Read more...]
May’s Low Inflation, the Price of Gold and More
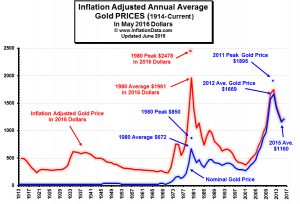
The U.S. Bureau of Labor statistics released the May inflation data on June 16th. Annual inflation fell from 1.13% in April to 1.02% in May. The Consumer Price index crept up to 240.236 from 239.261. Monthly inflation was 0.41% (40% of the total annual inflation). The primary factor in the increase was energy costs, gasoline was up 2.3% while fuel oil was up 6.2%. Many other items were actually down... airfares down -1.5%, used cars and trucks down -1.3%, food at home down -0.5%, of course physicians services and motor vehicle insurance were up 1% and 0.9% respectively, along with apparel which was up 0.8%. Current Annual Inflation Chart We’ve updated the current annual inflation chart … [Read more...]
CPI Reaches All-Time High
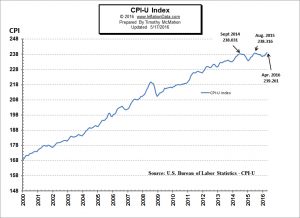
BLS Releases April Inflation Data The U.S. Bureau of Labor Statistics (BLS) released the inflation data for the year ending in April on May 17th, 2016. The Annual Inflation Rate was 1.13% up from 0.85% last month. The Consumer Price Index (CPI-U) reached an all-time high of 239.261. Normally, this wouldn't be news since for years it made a new high almost every month. But after peaking at 238.316 last August (2015) the index fell to 236.525 by December and took 8 months (until April) to climb above August's level. Interestingly, in September 2014 the index was 238.031. So it has taken 19 months for overall prices to exceed the level first attained in September 2014. This doesn't … [Read more...]
BLS Releases March CPI and Inflation
The U.S. Bureau of Labor Statistics released the March CPI and inflation numbers on April 14th. Annual Inflation fell from 1.02% for the 12 months ending in February to 0.85% for the 12 months ending in March. Interestingly, prices rose 0.43% for the month of March alone, so monthly inflation in March was almost exactly half of the total inflation for the entire year. The Consumer Price Index (CPI-U) was 238.132 up from 237.111 in February 2016 and 236.119 for March 2015. According the BLS Commissioner's report, " The food index declined in March, while the indexes for energy and for all items less food and energy rose, leading to the slight seasonally adjusted increase in the all items … [Read more...]
Inflation Down 25% in February
The monthly inflation numbers were released by the Bureau of Labor Statistics on Wednesday March 16th for February. Annual inflation was 1.02% down from 1.37% in January for a loss of 25%. The Consumer Price Index was 237.111 up from 236.916 in January but this was still below the peak levels of July 2015 at 238.654 indicating that overall prices are still lower than July (primarily gasoline) although other prices may be higher. Overall energy was -12.5% lower than a year ago, while medical care services were 3.9% higher and Hospital services were 5.1% higher as was Motor Vehicle insurance. Fruits and vegetables were 3.8% higher and food away from home was 2.6% higher. Annual Inflation … [Read more...]
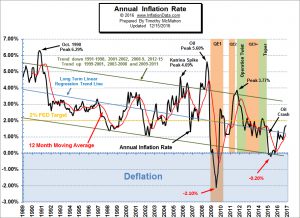
Central Banks Are Pushing the World Towards Deflation
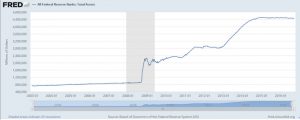
With the entire world struggling to ward off global deflation, it is prudent to understand why the current actions by the Central Banks are not heading in the correct direction. The massive amount of Quantitative Easing by the Central Banks, globally, have not been converted into inflation as was earlier anticipated. This article will shed light on various aspects leading to deflation. Investopedia defines ‘deflation’ as “a general decline in prices, often caused by a reduction in the supply of money or credit. Deflation can be caused also by a decrease in government, personal or investment spending. The opposite of inflation, deflation has the side effect of increased unemployment since … [Read more...]
