
With the entire world struggling to ward off global deflation, it is prudent to understand why the current actions by the Central Banks are not heading in the correct direction. The massive amount of Quantitative Easing by the Central Banks, globally, have not been converted into inflation as was earlier anticipated. This article will shed light on various aspects leading to deflation.
Investopedia defines ‘deflation’ as “a general decline in prices, often caused by a reduction in the supply of money or credit. Deflation can be caused also by a decrease in government, personal or investment spending. The opposite of inflation, deflation has the side effect of increased unemployment since there is a lower level of demand in the economy, which can lead to an economic depression. Central banks attempt to stop severe deflation, along with severe inflation, in an attempt to keep the excessive drop in prices to a minimum.”
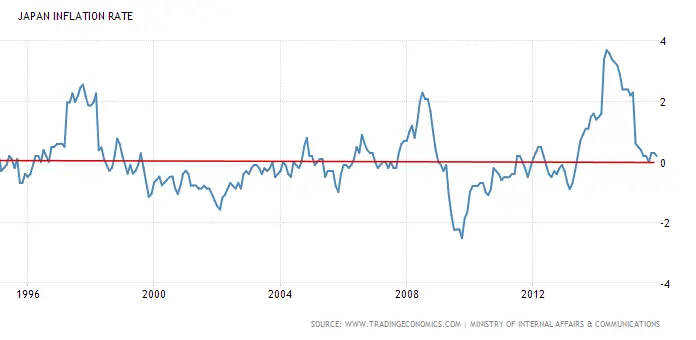
Japan in the grips of ‘deflation’ with zero interest rates in effect for 20 years:
The chart below displays the interest rate of Japan, which is closer to zero percent, since 1995. Economic principles suggest that Japan should have witnessed high inflation during these past twenty years. After all, with interest rates at zero percent, borrowers should have taken the opportunity to spend more. However, the chart below depicts the reality.

Japan Inflation Rate
The chart of inflation below paints a clear picture. Barring three spikes in inflation, Japanese inflation has been close to zero and has entered periods of ‘deflation’. After a brief enthusiastic period of time, Japan remains in the ‘deflation zone’, although the Bank of Japan has announced negative interest rates.
A few experts believe that Japan did not inject sufficient Quantitative Easing and did not maintain it long enough in order for results to come to fruition. Let’s study what the remaining Central Banks have done since the financial crisis in 2007. They continue to inject monetary stimulus in hopes of stoking inflation, but have they been successful?
Most central banks have recently cut rates to negative territory
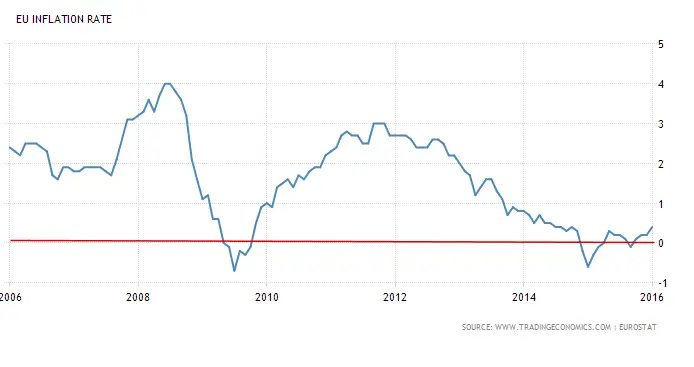
The European Central Bank President Mario Draghi maintains that his “Big Bazooka” has not been able to keep the European Union out of ‘deflation’. He stated “We will do whatever it takes to save the ‘Euro’.” has not been effective. Let’s compare this with what the FED has been able to achieve.
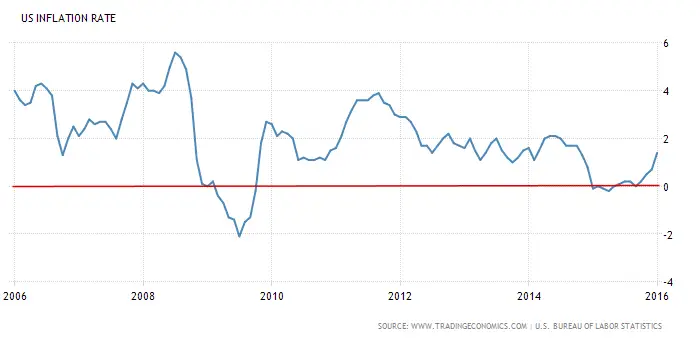
The situation in the US is somewhat better compared to that of the EU. However, even in the US, the FED has not been able to consistently keep inflation anywhere close to its target rate of 2%.
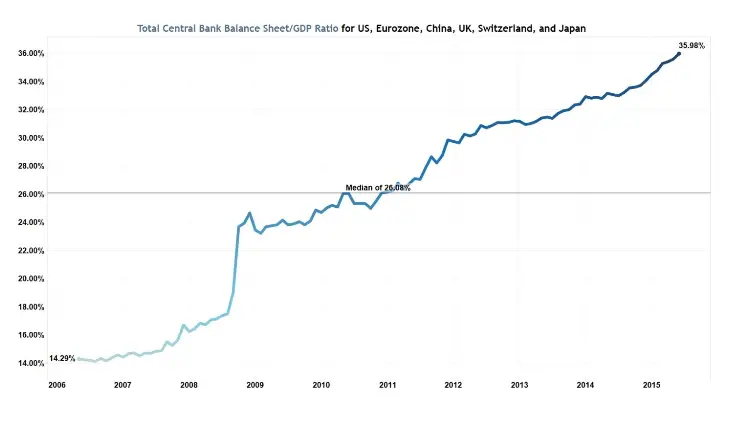
Have the Central Banks not injected sufficient liquidity into the economy?
From the below chart, it is clear to see that the Central Banks have resorted to massive Quantitative Easing programs, with little to if any results.
Why has it not led to inflation?

Why is there no inflation in the economy?
Since the end of the financial crisis, despite the FED and the other Central Banks having released massive amounts of QE, corporations and the public are not experiencing any economic recovery. The failure of the FED to induce growth and induce inflation, to desired levels, has further dented sentiment.
Companies have used the “easy lending” opportunity to clean up their books and have resorted to massive “buyback” programs rather than using the monies for infrastructure, R&D and upgrading their existing technologies.
According to a Reuters research report, since 2010, there have been 1900 companies that have resorted to ‘buybacks’ and ‘dividend’ payouts which have amounted to 113 percent of their capital spending. The proportion of net income spent on innovation has dropped from 60 percent in the 1990s to less than 50 percent since 2009 and consequently has risen only in 2014, because net incomes dropped, according to the analysis of some 1000 odd firms, which buy back shares and report Research & Development spending costs.
Reuters reports that almost 60 percent of 3,297 publicly traded non-financial companies have bought back ‘shares’ since 2010. In 2014, companies spent a staggering $520 billion in ‘buybacks’ and paid out $365 billion in ‘dividends’, for a total of $885 billion more than the combined net income of $847 billion. This has led to the benefits of an artificial ‘roaring stock market’.
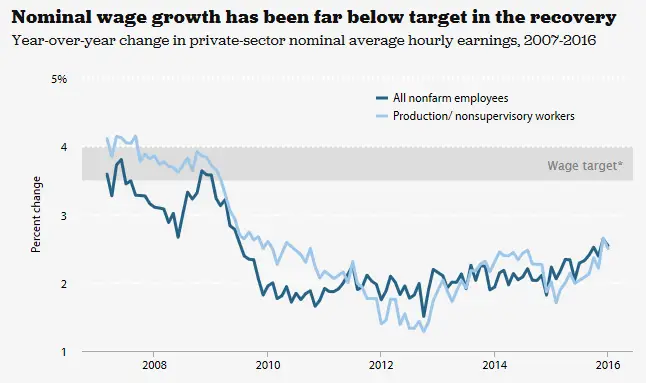
Without any economic recovery, how has wage growth performed?
It is clear from the below chart that the wage growth has been far from satisfactory. It continues to languish, at dismal levels, compared to the desired wage target of 3.5 to 4.00 percent. Although the unemployment rate is down, employers continue to refrain from raising wages, seeing as they are able to keep their employees’ wages low.
The below chart indicates the ‘depressed’ levels of wages received by employees as compared to the corporate income. The post crisis period continues to be among the worst period in the last 35 years. With no wage growth, employees continue to save rather than spend, as indicated in the chart below.
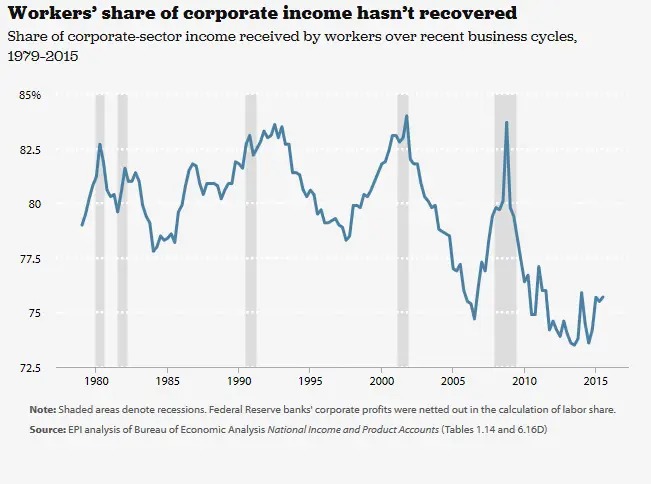 Editor’s Note: Although the percentage appears to rise during shaded periods it doesn’t mean that the workers actually got raises. If Corporate profits are close to zero and employee’s wages stay constant they will receive a greater portion of total income.
Will negative interest rates help?
The ECB was the first major Central Bank to resort to negative interest rates, then followed by Japan and meanwhile, experts believe that the U.S. will also soon follow. However, this extreme measure has not provided any relief to the ailing European Union. The Central Banks, in spite of their implemented measures, have encouraged businesses and people to hold on to their cash. Lower spending will lead to less demand, which will, in turn, lead to increased job losses and lower profits, which will encourage people to hoard their money. As prices fall, due to lower demand, people continue to postpone their purchases while waiting for prices to fall further.
Conclusion:
The Central Banks are reinforcing the fear that they are not in control of this situation, which has led to the ‘global current deflationary pressure’. When the firms and people look at the desperate attempts made by the Central Banks failures, they resort to saving their money so as to shield themselves during this current ‘financial crisis’.
The ‘deflationary pressures’ will continue to increase as various Central Banks resort to further QE, by different means. The world will have to incur a period of pain and the ‘The Global Reset’ will allow the market forces to return to normal. The harsh economic winter will continue for a period of 4-5 years. Continue following my reports for more insight of how to trade and safeguard your financial future through trading ETFs, during the forthcoming crisis.
This article courtesy of Chris Vermeulen – www.TheGoldAndOilGuy.com

Leave a Reply