
The monthly inflation numbers were released by the Bureau of Labor Statistics on Wednesday March 16th for February. Annual inflation was 1.02% down from 1.37% in January for a loss of 25%. The Consumer Price Index was 237.111 up from 236.916 in January but this was still below the peak levels of July 2015 at 238.654 indicating that overall prices are still lower than July (primarily gasoline) although other prices may be higher.
Overall energy was -12.5% lower than a year ago, while medical care services were 3.9% higher and Hospital services were 5.1% higher as was Motor Vehicle insurance. Fruits and vegetables were 3.8% higher and food away from home was 2.6% higher.
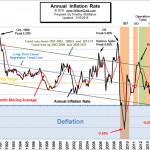 Annual Inflation Chart
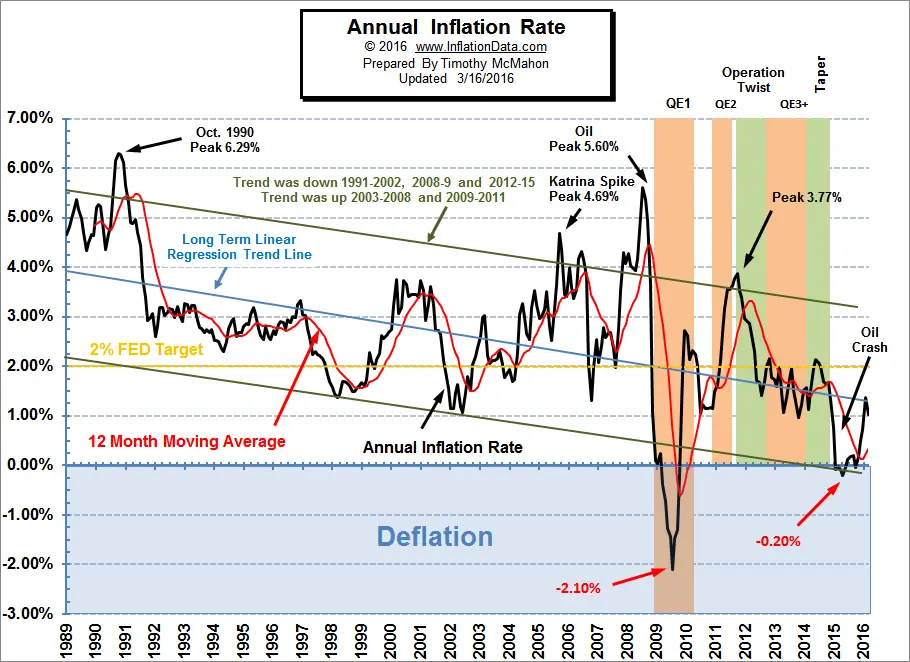
Annual inflation fell a bit from midpoint in the channel keeping it in the lower half. Typically monthly inflation during the first quarter of the year is very positive at around +0.40%per month. This year monthly inflation for January was a very moderate at 0.17% (which if annualized would result in 2.04% annual inflation). February’s monthly contribution to the Annual Inflation rate was even smaller at 0.08%. Since typically 90% of the Annual inflation occurs from January- May while October- December actually erases some of it so if January and February are any indication 2016 still looks like annual inflation could be well below the official FED target of 2%. See Annual Inflation Chart for more information.
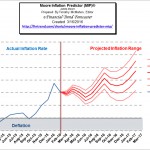 Inflation Projections (MIP)
Last month’s MIP was projecting a move down with an extreme low of 1.09% but with inflation reaching 1.02%, we got the direction right but didn’t quite get the entire magnitude of the move. Monthly inflation was 0.08% replacing a 0.43% for February 2015.
This month we have an even larger positive number falling out of the equation, i.e. 0.60% but with gas prices rising drastically we could match that this year as well. So the MIP is undecided as to which direction March will take us. See: MIP for more information.
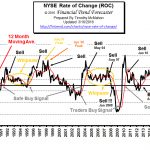 NYSE Rate of Change (ROC)
The NYSE has taken a series of tumbles over the last 7 months (i.e. since August 2015). But recently we have seen a bit of a rebound which the media is taking as the sign of a new bull market.
But the NYSE Rate of Change still has a sell signal and remains below zero, hopefully the market will begin to pick up (but I wouldn’t hold my breath).
A lot depends on the FED actions and how “accommodating” their policy is from here on out. A move above zero or the moving average will generate a “Buy Signal”. See NYSE-ROC for more information.
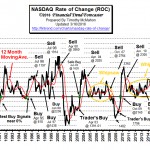 NASDAQ Rate of Change (ROC)
Although the NASDAQ index was slightly higher versus last month the annual rate of return remains a loss for the previous 12 months at -4.93%. This is still considerably better than the NYSE which is currently looking at a year-over-year LOSS of -8.91%. The NASDAQ rate of return continues to be below its moving average and the NASDAQ ROC continues its SELL signal!
See NASDAQ ROC for more information.
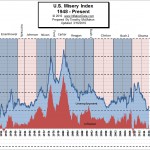 Misery Index
The misery index as of March 2016 (based on the most recent official government data for the 12 months ending in February) is at 5.92% (4.9% unemployment and 1.02% inflation) down from a peak of 12.87% in both October and November 2011 which was pretty miserable. But still above the September 2015 low of 5.06%. With inflation at historically low levels the major component of the Misery index is unemployment. See Misery Index for more info.
You may also like:
- Central Banks Are Pushing the World Towards Deflation
- Electric Car War Sends Lithium Prices Sky High
- The Truth About the Russia-Saudi Oil Deal
- 5 Simple Steps to Take Control Of Your Financial Future
- Tax Season Tricks to Get the Best Return
- Financial Survival for Seniors
- Avoiding Medical Overcharges, Errors and Extortion
- They Don’t Ring a Bell at Market Tops (or Bottoms)
- 6 Things Your Insurance Company isn’t Telling You
- February Unemployment Flat

Leave a Reply