
History shows that the U.S. should pay attention to economies in Europe The economy has been sluggish for five years. There's no shortage of chatter about "why," yet few observers mention deflation. One exception is a hedge fund manager who spoke up at the recent Milken Institute Global Conference. The presentation by Dan Arbess, a partner at Perella Weinberg and chief investment officer at PWP Xerion Funds, was startling because of how deeply it broke from the standard narrative. We've been wrong to assume that the economic crisis is over, Arbess said. ... The threat of deflation is once again rearing its head. "The persistent risk in our economy is deflation not inflation," Arbess … [Read more...]
Syria in the Throes of Hyperinflation
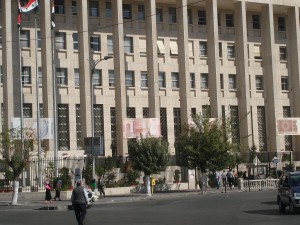
Living in the United States or other "stable" countries, we tend to think that Hyperinflation is a relatively uncommon event but that is far from the truth. In our post What is Hyperinflation? We list 26 instances of hyperinflation 11 of which have occurred since 1990. It seems that every couple of years there is another one. Even in the midst of deflationary pressures we have seen Zimbabwe (which ended in 2008), North Korea (2010-13) and now Syria. In Surviving a Hyperinflation we noted that "Hyperinflation only occurs in countries where the government has already broken down. Weimar Germany was mired in a social Civil War… Zimbabwe never had a working democratic government and the … [Read more...]
Rising Inflation vs. FED Tapering
Up until recently we rarely heard the word "tapering" but now it seems to be everywhere. Why? Because in June FED chairman Ben Bernanke floated a "trial balloon" and mentioned "tapering". By this he meant that he was considering slowly closing the faucet that is currently gushing easy money, i.e. $85 billion a MONTH. The stock markets promptly had a temper tantrum and Bernanke blinked and said, oh I was only kidding... I will eventually have to scale back but it won't happen any time soon... don't worry. He also said that the Fed's 6.5% target for US unemployment should be considered a "threshold, not a trigger" and that the FED would continue to support the economic recovery, "even as the … [Read more...]
The Effects of Tapering Off the FED’s Stimulus Program

Here's an economic irony for you. Less inflation means lower prices for you and I. However, to some who work for the Federal Reserve, that means things are off target and the economy still needs more work. Huh? What? It seems slightly fuzzy, but when you look at the larger macro-economic picture, things slowly start to come into focus. To a certain extent, inflation is actually good for the economy. The slow growth of inflation is one of many variables that is prompting speculation about whether or not the Federal Reserve should start tapering back its quantitative easing (stimulus) of the economy. Recent Inflation Drop Prompts Speculation In the May 2013 release of the April data, the … [Read more...]
Highest Grossing Movies Adjusted for Inflation

Traditionally, war films, musicals and historical dramas have been the most popular genres and Gone With the Wind held the record of highest-grossing film for 25 years but doesn't even make it into the top fifty in the modern market. But purchasing power varies widely over the time period since Gone With the Wind was first released in 1939. But the true key to determining how revenues really compare is when you adjust them for inflation. Highest-grossing films (Nominal) First we will look at nominal gross box office revenues. That is the actual number of dollars (not adjusted for inflation) earned strictly in the box office. Modern films have an advantage because in addition to box office … [Read more...]
Experimental (Reckless) Monetary Policy

In the following article Bill Bonner makes some excellent points about the problem with the current monetary policy. The first is that it is totally ludicrous to try to buy real goods with fake money. It has to cause distortions in the overall economy. "People make different decisions when they can borrow for practically nothing... " Secondly, once it gets started, without some form of real recovery it will be impossible to stop. Kind of like a drug addict. The withdrawal will be painful and won't happen until something forces the FED's hand. And thirdly also just like drug addicts and unsuccessful people the world over the FED is taking a short term view. It is a proven fact that the most … [Read more...]
Is Ben Bernanke “Shooting Blanks”?
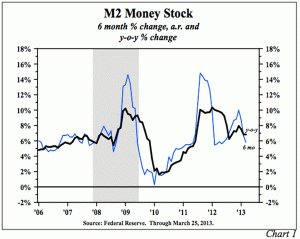
Summary: Lacy Hunt and Van Hoisington launch into their first-quarter "Review and Outlook," this week with a statement that some may find eye-opening: "The Federal Reserve (Fed) is not, and has not been, 'printing money'…" But given the facts of life about how money is really created (and destroyed), they are of course right: it's all about the acceleration – or deceleration – in the M2 money supply. Van and Lacy say, "A review of post-war economic history would lead to a logical assumption that the money supply (M2) would respond upward to [the Fed's] massive infusion of reserves into the banking system. Mystery Math- Monetary Base up 350%, M2 Up 35%? And yet, the Fed's 3.5x … [Read more...]
Long Term U.S. Inflation
We have updated the charts on long Term Inflation, including Average Annual Inflation by decade, Cumulative Inflation by Decade and Cumulative Inflation since 1913. The Chart below shows the Annual Inflation Rates for each decade. Each bar represents the average Annual Inflation for that decade (not the total cumulative inflation for that 10 year period but how much it increased each year on average during that decade). Do you know: 1) Average Annual Inflation since 1913: 2) That deflation in the "Roaring 20's" was almost as bad as in the "Great Depression" of the 1930's? 3) How Crop Subsidies affected farm prices in the 1920's and 30's? 4) How the proliferation of … [Read more...]
Inflation Trends since 1914- The 15 year Cycle
Inflation like everything else it seems has cycles. It trends up for years and then for almost no reason begins falling again. After a while it rises again. Unfortunately, while it is doing its long term dance it is bouncing up and down creating so much "noise" that it is difficult to see the longer term trend. The chart below shows this trend by adding a 5 year moving average to the inflation rate. This smooths out the noise so we can see the underlying trend. And surprisingly it is actually quite regular. Inflation Cycles Approx. Every 15 Years From the chart we can see that beginning in 1917 we had 15 years of declining inflation until the bottom in 1932. From there inflation … [Read more...]
Why Inflation is U.S. Hottest Export

Last week, we went to São Paulo, Brazil. There, too, we found taxi drivers who knew a lot more about monetary crises than the typical US economist. Said one: I remember. I was just a kid. But my father would call and tell us to run to the grocery store. He had just been paid. We'd dash for the grocery story, meet him there and buy everything we could. We spent every cent in just a few minutes. Our friend was recalling what it was like in the late 1980s in Brazil. The government had caused inflation... then hyperinflation. Prices rose so fast that as soon as people got some cash they ran to the grocery store to spend it. Later, there was no point. In 1990, hyperinflation in … [Read more...]
