• Home
  • Related Sites
    • Financial Trend Forecaster
      • Moore Inflation Predictor
      • NYSE Rate of Change (ROC)
      • NASDAQ Rate of Change (ROC)
      • Crypto ROC- BTC & ETH
    • Unemployment Data
      • Historical Employment Data
      • Unemployment Rate Chart
      • Labor Force Participation Rate
    • Optio Money
    • Elliott Wave University
    • More Resources
  • Definitions
    • What is Inflation?
    • What is Core Inflation?
    • Inflation vs CPI
    • What is Deflation?
    • What is Disinflation?
    • What is Agflation?
    • What is Stagflation?
    • What is Hyperinflation?
    • What is Quantitative Easing?
    • What is Quantitative Tightening?
    • What is Velocity of Money?
    • What is Fiat Currency?
    • How Do I Calculate Inflation?
    • What are “Sticky Prices” and Why Do They Matter?
  • Featured Content
  • About Us
  • Feedback
    • Sitemap
  • Subscribe Now

InflationData.com

Your Place in Cyber Space for Inflation Data

  • Numerical Inflation Data
    • Current Inflation Rate
    • Monthly Inflation Rate (Moved)
    • Historical U.S. Inflation Rates
    • Historical CPI
  • Inflation Charts
    • Ann. Inf. Rate Chart
    • Long Term Inflation >
      • Ave. Inf. by Decade
      • Total Inf. by Decade
      • Inflation 1913-1919
      • Inflation 1920-1929
      • Inflation 1930-1939
      • Inflation 1940-1949
      • Inflation 1950-1959
      • Inflation 1960-1969
      • Inflation 1970-1979
    • Cumulative Inflation
    • FED Monetary Policy and Inflation
    • Inflation and Recession
    • Confederate Inflation (1861 – 1865)
    • Misery Index
    • The 3 Stages of Inflation
    • 15-Yr Inflation Trends Chart
  • Inflation Calculators
    • Cumulative Inf. Calc.
    • How Much Would it Cost
    • Historical Inflation Calculator since 1774
    • Salary Inf. Calc.
    • U.K. Inf. Calc.
    • Cost of Gas Calc.
    • Net Worth Calc.
    • Lifetime Earnings Calc.
    • Savings Goal Calc.
    • Financial Calculators
  • Inf. Adjusted Prices
    • Energy >
      • Inflation Adj. Gas Prices
      • Historical Oil Prices Chart
      • Crude Oil Price (Table)
      • Natural Gas Prices
      • Electricity Prices
      • Oil vs Gold
    • Gold >
      • Inflation Adjusted Annual Average Gold Prices
      • Gold is a “Crisis Hedge” not an  “Inflation Hedge”
      • Comparing Oil vs. Gold
    • Corn Prices
    • Education Inflation
    • Housing Prices
    • Mortgage Rates
    • NYSE Index
    • Inf. Indexed Bonds
    • Movie Revenues
    • Inflation-Adjusted Wages
  • Cost of Living
    • Calculate Cost of Living
    • Cost-of-living Adj. (COLA)
    • Consumer Price Index CPI
      • Historical CPI
      • Current CPI
      • CPI Release Dates
    • Gas Prices >
      • Cost of Gas
      • Cost of Gas Per Month
      • Gas vs. Oil Price Chart
    • Food Prices 1913 vs 2013
    • Health Insurance
  • Blog
    • Key Inflation Articles
    • International Inflation
    • Historical Inflation Rates for Japan (1971 to 2014)
You are here: Home » Blog » Government » The Federal Reserve » Tapering » Rising Inflation vs. FED Tapering

Rising Inflation vs. FED Tapering

Published on July 20, 2013 Updated on June 2, 2021 by Guest Author Leave a Comment

Up until recently we rarely heard the word “tapering” but now it seems to be everywhere. Why? Because in June FED chairman Ben Bernanke floated a “trial balloon” and mentioned “tapering”. By this he meant that he was considering slowly closing the faucet that is currently gushing easy money, i.e. $85 billion a MONTH. The stock markets promptly had a temper tantrum and Bernanke blinked and said, oh I was only kidding…  I will eventually have to scale back but it won’t happen any time soon… don’t worry. He also said that the Fed’s 6.5% target for US unemployment should be considered a “threshold, not a trigger” and that the FED would continue to support the economic recovery, “even as the pace of recovery is picking up”.

In an attempt to reassure investors, he used a driving analogy saying,  the Fed will behave like a driver “letting up on the gas peddle as a car picks up speed”, i.e. don’t worry we won’t slam on the brakes.  He also left himself an out saying, that the tapering plan is not set in stone and can be adjusted at any point depending on whether America’s economic recovery meets expectations.

But based on the anemic recovery which is almost exclusively due to easy money, it is difficult to see how he will be able to keep the stock market afloat and taper at the same time. Today Chris Ciovacco looks at the market with all this tapering and inflation talk. Personally, I think all the concern over the renewing in inflation is currently overdone. The increase in the annual inflation rate is primarily because a negative number fell out of the calculation. We have one more to go and then the inflation rate will fall again. See our Moore Inflation Predictor for more information.~Tim McMahon, editor

Will Rising Inflation Renew Tapering Debate?

by Chris Ciovacco, Ciovacco Capital Management

Inflation Higher Than Expected

The if/when associated with the Fed’s plan to taper its bond purchases got a “sooner rather than later” economic data point Tuesday. As we noted Monday, one of the fears within the Fed is for their unprecedented campaign of money printing to eventually lead to higher than anticipated consumer prices. From Reuters:

The Labor Department said its Consumer Price Index increased 0.5 percent, the largest rise since February, after nudging up 0.1 percent in May. Gasoline prices accounted for about two thirds of the increase in the CPI. Economists polled by Reuters had expected consumer inflation to increase 0.3 percent last month. In the 12 months through June, consumer prices advanced 1.8 percent after rising 1.4 percent in May. It was also the largest increase since February.

Markets Do Not Move Straight Up

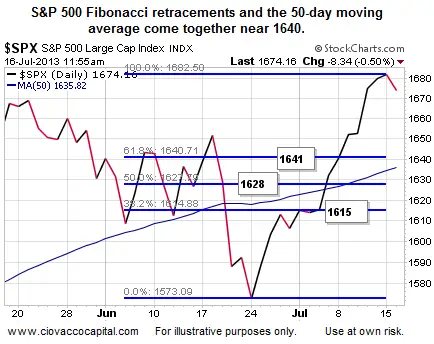
The S&P 500 was down 7 to 9 points in late morning trading Tuesday. Given the S&P 500 has gained 124 points over the last three weeks, some “give back” is normal and to be expected. Traders monitor Fibonacci levels since they can offer clues to areas where buyers may again surface during a pullback. The chart below shows the retracement levels based on the June 24 closing low and July 15 closing high.

S&P Fibonacci retracements and the 50-day moving average come together near 1640

Earnings: No Warm Reception Tuesday

Goldman Sachs (GS) beat earnings expectations, but was still down over 1% around lunch time Tuesday. The mid-day bias seemed to skew bearishly when it came to earnings. Even a rosy report from Johnson & Johnson (JNJ) elicited a relatively tame response. From Bloomberg:

Coca-Cola (KO) fell 2.2 percent as the beverage company said volumes missed estimates amid slowing economic growth. Cintas (CTAS) dropped 2.3 percent after the uniform maker forecast earnings for the current fiscal year that were below estimates. Goldman Sachs (GS) lost 1.2 percent even after profit beat analysts’ projections. Johnson & Johnson added 0.3 percent as profit more than doubled and the company boosted its earnings forecast.

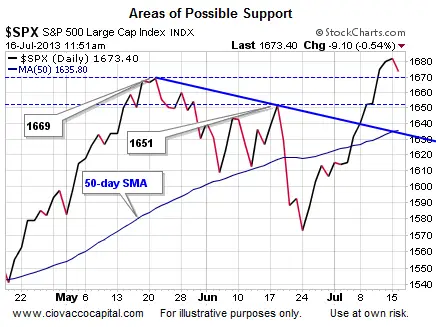
What Once Was Resistance

Traders have a time-tested expression what once was resistance may now act as support. Based on that simple premise, if the tapering and earnings induced selling continues, the S&P 500 could find buying support near 1669 (May high), 1651 (June high), or 1630ish (blue trendline recently broken).

Areas of Possible Support

Investment Implications

After seeing the S&P 500 add 124 points in three weeks, it may be time for a healthy pullback. However, as noted on Twitter, the market is not always cooperative for those with large stashes of cash.

Chris Ciovacco tweet

The market seems to have digested the tapering message from the Fed allowing for a bullish bias over the past three weeks. Our weekend video noted the technical bias is bullish from an intermediate-term perspective (several weeks). As long as that tapering bias remains intact and the technical trend is up, we will hold our broad U.S. positions (SPY) and leading sectors, such as small caps (IWM), financials (XLF), and technology (QQQ) through any “give back” that remains within the realm of normal.

See Also:

  • What is the Real Definition of Inflation?
  • What to Do When – Not If – Inflation Gets Out of Hand
  • Why Inflation is U.S. Hottest Export

Resources:

Inflation-Proof Your Portfolio: How to Protect Your Money from the Coming Government Hyperinflation The Great Super Cycle: Profit from the Coming Inflation Tidal Wave and Dollar Devaluation Inflation Investing: A Guide for the 2010s, Volume 1 (Essentials for Creating a Portfolio) When Money Dies: The Nightmare of Deficit Spending, Devaluation, and Hyperinflation in Weimar Germany

Filed Under: Inflation, Tapering, The Federal Reserve Tagged With: inflation, quantitative easing, Tapering

Leave a Reply Cancel reply

Your email address will not be published. Required fields are marked *

This site uses Akismet to reduce spam. Learn how your comment data is processed.

Recent Posts

  • May 2026: BLS April Inflation
  • How will FED Chairman Warsh affect Rates and Inflation?
  • Ben Cowan: Is the Fed Heading Toward Checkmate?
  • The Truth About Truflation vs. the BLS’s CPI
  • Massive March 2026 Inflation Spike

Subscribe Now

eTrends Signup Form

A Message from Our Editor

Eliminate Debt

Post Archives

Sponsored:

As a Seasoned Investor I thought I'd seen everything... But recently I discovered TradingView which has really improved the information I have at my fingertips.~ Tim McMahon, editor

TradingView gives me an edge... including powerful charting tools, real-time market data, and a global community of traders—all in one easy to use platform. It has hundreds of indicators, and even custom scripts for more advanced users, and you don't need to change Brokers just use its seamless brokerage integration... TradingView isn't just a charting tool—it's your full trading command center.

Trade smarter. Trade faster. Check Out TradingView for free.

----------

The Best Place to Buy Your Crypto

Coinbase is the largest Crypto Trading platform in the U.S. and the easiest to use. ~Tim McMahon, editor

Check out Coinbase here

Home | Articles | Sitemap | Terms of Service | Privacy | Disclaimer | Advertise With Us

Copyright © 1996-2026 · Capital Professional Services, LLC · Maintained by Design Synergy Studio · Admin

Do Not Sell My Personal Information