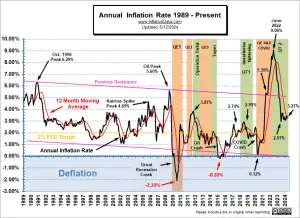
The U.S. Bureau of Labor Statistics released its May Inflation report on June 12th showing Annual Inflation was down from 3.4% in April to 3.3% in May. (But since we calculate it to two digits, it was actually 3.36% in April and 3.27% in May.) On a Seasonally adjusted basis, monthly inflation in May was ZERO. Bloomberg is making a big deal about that, but what does it really mean? As, I've been saying, beginning in the May-June timeframe inflation typically moderates for the Summer months and then gets really low (or even negative) in the 4th quarter. And that is what is happening. Double Whammy Day The overnight markets were down expecting more inflation so when the report was released … [Read more...]
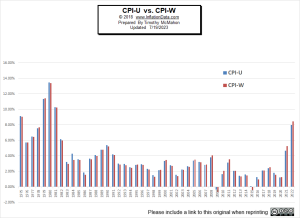
What is the Difference between the CPI-U and the CPI-W
The Consumer Price Index (CPI) is a widely used economic indicator that measures changes in the prices of goods and services over time. It measures the average change overtime in the prices paid by urban consumers for a market basket of consumer goods and services. Being an index, a date was chosen to be equivalent to 100, and as the price of the goods in the "basket" increased the index increases as well. The percentage difference between the index a year prior and the current index is the inflation rate. Having a reliable index is an essential tool for policymakers, economists, and individuals alike to assess inflation and make informed decisions. However, there are different variations … [Read more...]
Does the CPI Exclude Mortgages or Rent?
I recently got the question, Why does the CPI exclude rent? So I'm answering that here. The Consumer Price index doesn’t exclude rent. It actually has an entire section entitled “Shelter”. But not everyone rents... some people actually own their own homes. So to cover everyone they created a sort of hybrid rent/ownership component to the CPI called “owner’s equivalent rent”. According to the Bureau of Labor Statistics who calculate the CPI, “The expenditure weight in the CPI market basket for Owners’ Equivalent Rent of primary residence (OER) is based on the following question that the Consumer Expenditure Survey asks of consumers who own their primary residence: “If someone were to … [Read more...]
Annual Inflation Soars to Highest Level in 31 Years
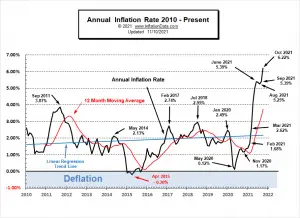
The Annual Inflation Rate exploded in October, according to the Bureau of Labor Statistics report. Inflation Summary: Annual Inflation highest since October 1990. CPI Index rose from 274.310 to 276.589. Monthly Inflation for October was 0.83% Next release December 10th Inflation for the 12 months ending in October was Up Sharply from September. September 5.39% October 6.22% Current levels have exploded through the pink resistance line. Exceeding the 5.60% Oil Peak of July 2008, and coming very close to the October 1990 peak at 6.29%. If next month takes it up even slightly we will have to go all the way back to 1982 to see higher inflation. BLS … [Read more...]
February Inflation Increases 20% over January
Inflation Summary: Annual Inflation up from 1.40% in January to 1.68% in February. CPI Index rose from 261.582 in January to 263.014 in February. Monthly Inflation for January was 0.43% and February was 0.55%. Next release April 13th Annual inflation for the 12 months ending in February was 1.68%, a 20% increase over January's 1.40% The CPI index itself was up from 261.582 in January to 263.014 in February. Resulting in a monthly inflation rate of 0.55% which replaced February 2020's 0.27%. Annual inflation for the 12 months ending in February was 1.68%, since the BLS rounds their numbers they report it as 1.7%. Setting the Stage for Inflation Due to the Corona … [Read more...]
June Inflation: Down Again
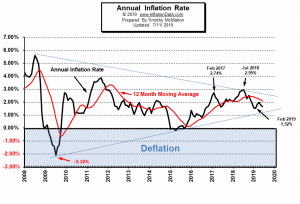
The U.S. Bureau of Labor Statistics (BLS) released their monthly Consumer Price Index report on July 11th 2019, for the 12 months through June 2019. Annual Inflation is Down Again Annual inflation in June was 1.65% down slightly from May's 1.79% which was down from 2.00% in April. The CPI-U Index was 256.143 up marginally from May's 256.092. Monthly Inflation for June was only 0.02%, May was 0.21%, April was 0.53%, March was 0.56%, June 2018 was 0.16%. Next release August 13th Annual inflation for the 12 months ending in June was 1.65% which is below the FED target of 2.00% which may account for FED Chairman Jerome Powell's signaling that the FED will be … [Read more...]
July Inflation Up a Fraction
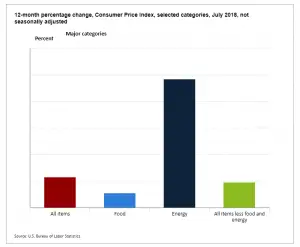
On August 10th 2018, the U.S. Bureau of Labor Statistics released their monthly Consumer Price Index report on the status of Inflation for the 12 months through the end of July. Annual Inflation is Up Very Slightly Annual inflation in July was 2.95% up slightly from 2.87% in June. (BLS rounds both to 2.9%) CPI was 252.006 in July and 251.989 in June. Monthly Inflation for July was 0.01%, and 0.16% in June compared to -0.07% in July 2017. Next release September 13th Monthly Inflation: Annual inflation for the 12 months ending in July was 2.95% up from 2.87% in June. The U.S. Bureau of Labor Statistics (BLS) rounds both to 2.9% and accordingly reports the inflation rate … [Read more...]
Annual Inflation Up Sharply in May
The U.S. Bureau of Labor Statistics released the Annual Inflation Rate data for the year through the end of May on June 12th 2018. Annual Inflation is Up Annual inflation rate was 2.80% in May up from 2.46% in April, 2.36% in March and 2.21% in February. CPI-U was 251.588 in May, 250.546 in April, 249.554 in March, 248.991 in February, 247.867 in January and 246.524 in December. Monthly Inflation for May was 0.42%, April was 0.40%, up from 0.23% in March 2018. May 2017 was only 0.09% Next release July 12th Monthly Inflation: Annual inflation for the 12 months ending in May was 2.80% up sharply from April's 2.46% the increase was primarily because May 2017's … [Read more...]
July CPI Down But Inflation Up
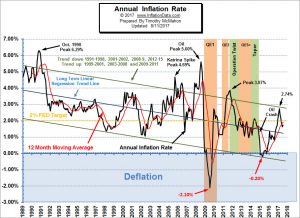
The Bureau of Labor Statistics Released the Inflation Data for the Year ending in July on August 11th. Annual inflation was 1.73% in July - Up from 1.63% in June, but down from 1.87% in May, 2.20% in April, 2.38% in March, 2.74% in February, and 2.50% in January. CPI 244.786 in July down from CPI 244.955 in June Monthly Inflation for July -0.07%, June 0.09%, May 0.09%, April was 0.30%, March was 0.08%, February was 0.31% and 0.58% in January. Next release September 14th The reason the CPI went down but inflation went up is because July 2016 monthly inflation was -0.16% and this July was less negative. So CPI goes down for the month but not as much as last year so Annual … [Read more...]
Consumer Price Index Definition
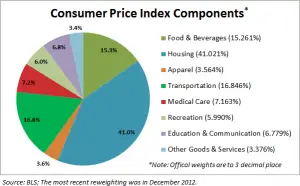
What is the Consumer Price Index? The Consumer Price Index is simply a basket of goods that is used by the Bureau of Labor Statistics to gauge how much price inflation the economy is experiencing. It is "weighted" based on how much of each good the average family uses. Therefore if 41% of your expenses are related to the housing category and 3.6% of your expenses are related to the apparel category and Apparel goes down by 1% and housing goes up by 1% your overall expenses will still be going up. In other words, if you spend $820 on rent a month and $72 on clothes a 1% increase in your rent would add $8.20 to your monthly rent expenses while a -1% would only save you $0.72 on … [Read more...]

