
The U.S. Bureau of Labor Statistics (BLS) released their monthly Consumer Price Index report on July 11th 2019, for the 12 months through June 2019.
Annual Inflation is Down Again
- Annual inflation in June was 1.65% down slightly from May’s 1.79% which was down from 2.00% in April.
- The CPI-U Index was 256.143 up marginally from May’s 256.092.
- Monthly Inflation for June was only 0.02%, May was 0.21%, April was 0.53%, March was 0.56%, June 2018 was 0.16%.
- Next release August 13th
Annual inflation for the 12 months ending in June was 1.65% which is below the FED target of 2.00% which may account for FED Chairman Jerome Powell’s signaling that the FED will be lowering interest rates.
Monthly Inflation:
According to the BLS commissioner’s report, “The Consumer Price Index for All Urban Consumers (CPI-U) increased 0.1 percent in June on a seasonally adjusted basis, the same increase as in May, the U.S. Bureau of Labor Statistics reported today. Over the last 12 months, the all items index increased 1.6 percent before seasonal adjustment.
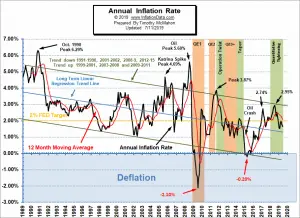
Since the peak in July 2018, the inflation rate began trending down from the top of the downward sloping channel toward the midline but March and April displayed a counter-trend rally with it moving back toward the top of the channel. May and June, however, had the inflation rate falling back below toward the mid-line of the channel. Read the full commentary here.
Current Inflation Chart
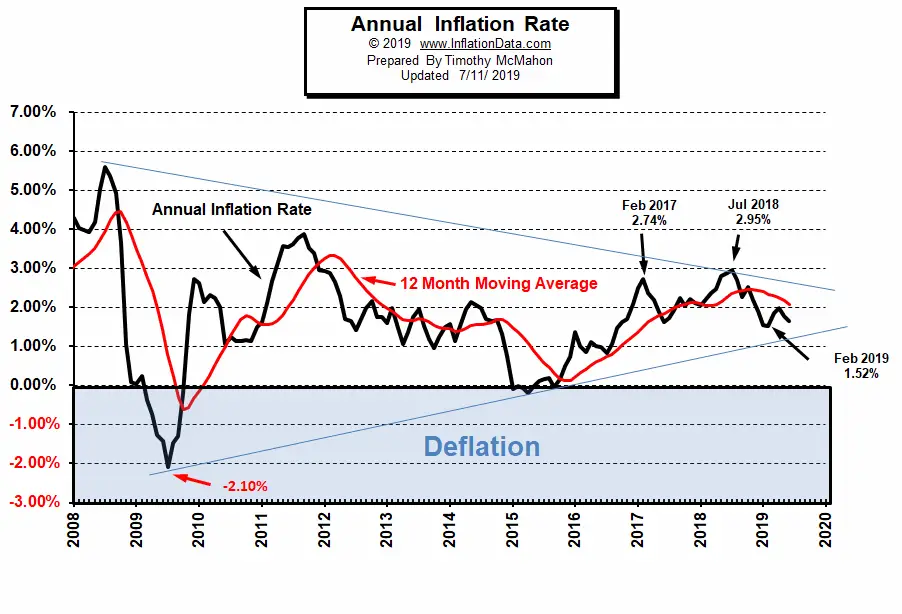
If we look at the shorter term chart we can see that over the last ten years there hasn’t been a decisive trend in either direction. As a matter of fact, it looks more like it has gotten less volatile (see blue converging lines) and is settling down in the middle of the road near the 2.00% FED target. Is it possible that after 100 years the FED has finally gotten the hang of managing inflation? Probably not, but we can hope. More likely, it is just a decrease in volatility after the massive crash of 2008.
Federal Reserve Actions
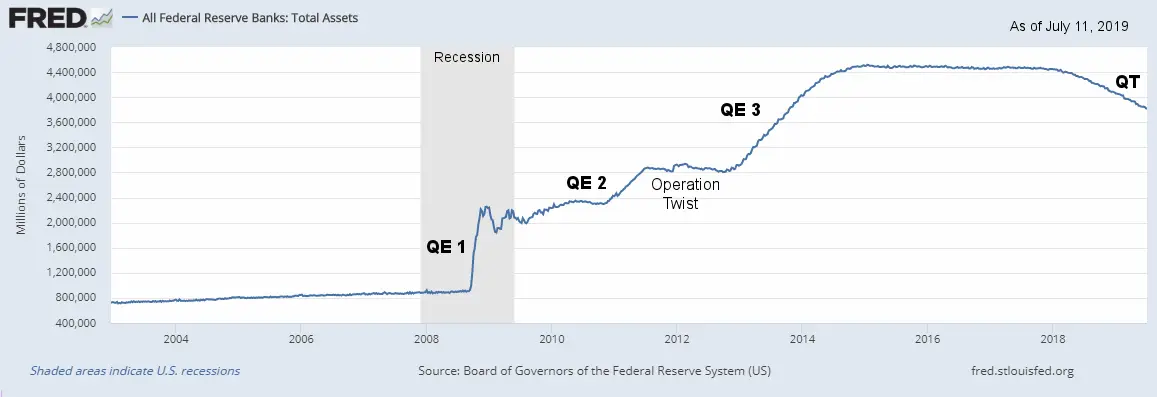
Throughout 2018 the Federal Reserve actively clamped down on the economy, both in raising interest rates and in eliminating the debt it acquired during its Quantitative Easing thus beginning its Quantitative Tightening (QT). QT continued throughout June despite FED proclamations back in December and January that it was going to follow a more easy money policy.
- Quantitative Tightening (QT) continues… check it out here.
- What is Quantitative Tightening?
 For more info See NYSE ROC and MIP.
Seasonally Adjusted Inflation Table
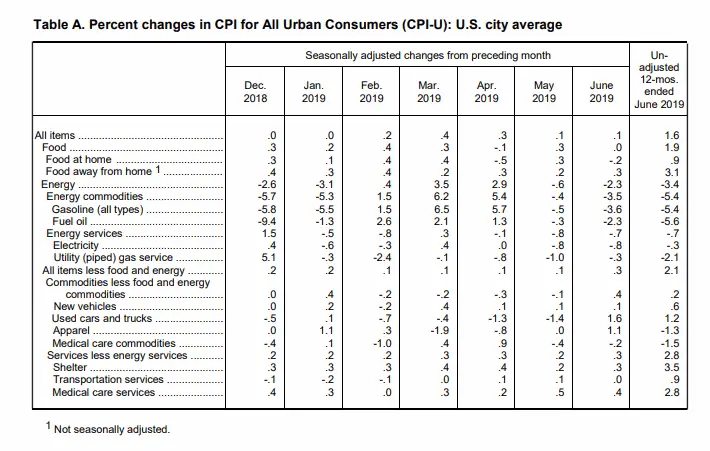
From the June 2019 column in the table above we can see that on a monthly seasonally adjusted basis most Energy items were actually negative with the entire Energy category down -2.3%. Used Cars and Trucks were up 1.6% after being down -1.4% last month. Apparel is up 1.1% on the month. On an annual unadjusted basis, energy is down -3.4%, while shelter is up 3.5%, food is up 1.9%, and medical care services are up 2.8%.
Inflation Forecast
See our Moore Inflation Predictor to see our current projections.
Not Seasonally Adjusted Monthly Inflation Rates
| Jan | Feb | Mar | Apr | May | Jun | Jul | Aug | Sep | Oct | Nov | Dec | |
| 2016 | 0.17% | 0.08% | 0.43% | 0.47% | 0.41% | 0.33% | (0.16%) | 0.09% | 0.24% | 0.12% | (0.16%) | 0.03% |
| 2017 | 0.58% | 0.31% | 0.08% | 0.30% | 0.09% | 0.09% | (0.07%) | 0.30% | 0.53% | (0.06%) | 0.00% | (0.06%) |
| 2018 | 0.54% | 0.45% | 0.23% | 0.40% | 0.42% | 0.16% | 0.01% | 0.06% | 0.12% | 0.18% | (0.33%) | (0.32%) |
| 2019 | 0.19% | 0.42% | 0.56% | 0.53% | 0.21% | 0.02% |
See: Monthly Inflation Rate for more information and a complete table of Unadjusted Monthly Rates.
Not Seasonally Adjusted Annual Inflation (by Category)
| Category | Annual |
| All Items | 1.65% |
| Food | 1.9% |
| Energy | -3.4% |
| All Items less Food and Energy | 2.1% |
| Apparel | -1.3% |
| New Vehicles | 0.6% |
| Used Cars and Trucks | 1.2% |
| Shelter | 3.5% |
| Medical Care Services | 2.8% |
| Transportation Services | 0.9% |
Food and Energy Breakdown
The BLS publishes an index entitled “All items Less Food and Energy” which often causes people some confusion. It doesn’t mean they stopped including food and energy in the Consumer Price Index. It just means that they have broken them out so you can compare their increase to other components. For more info see What is Core Inflation?
Misery Index
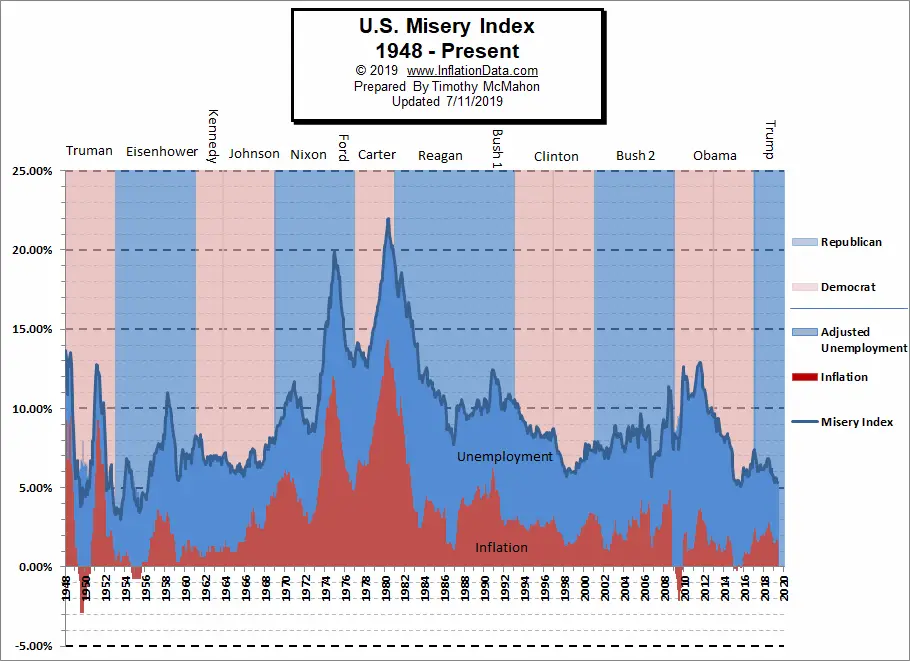 The misery index as of July 2019 (based on the most recent official government inflation and unemployment data for the 12 months ending in June) is at 5.35% down from 5.88% in December 2018.
It had reached a low of 5.32% in February 2019. But it was 6.87% in July 2018 and 7.44% in February 2017. [Read More…]
NYSE Rate of Change (ROC)©
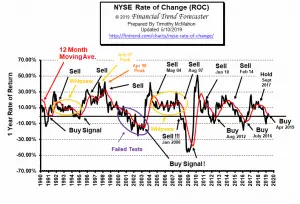 Unfortunately, after generating the buy signal in March the market lost a bit of ground. So rather than getting a decisive cross, we got mixed signals. But as of July, the buy signal is back in effect.
See the NYSE ROC for more info.
NASDAQ Rate of Change (ROC)©
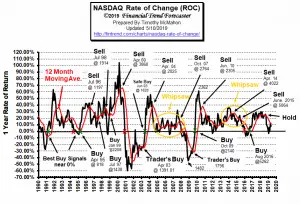
Hold Signal! Unlike the NYSE, the NASDAQ- ROC is currently still below the moving average.
In July it has rebounded a bit and is once again testing its moving average and so with the positive hints from FED chairman Jerome Powell we expect the market to break through the moving average shortly.
See NASDAQ ROC for more.
Regional Inflation Information
The U.S. Bureau of Labor Statistics also produces regional data. So if you are interested in more localized inflation information you can find it here.
| AL | AK | AR | AZ | CA | CT | CO | DC | DE | FL | GA | GU | HI | IA |
| ID | IL | IN | KS | KY | LA | MA | MD | ME | MI | MN | MO | MS | MT |
| NC | ND | NE | NH | NJ | NM | NV | NY | OH | OK | OR | PA | PR | RI |
| SC | SC | SD | TX | UT | VA | VI | VT | WI | WA | WI | WV |
You Might Also Like:
From InflationData.com
- Gold Price and Its Relationship with Inflation
- What is Quantitative Tightening?
- What is Quantitative Easing?
- How Does Inflation Affect Foreign Exchange Rates
- Oil Price Inflation Charts and Tables Updated
- Health Insurance Inflation
- Are Deflationary Forces Taking Hold Again?
- Gold as an Investment
Read more on UnemploymentData.com.
- June Unemployment Higher
- Best Side Hustles of 2019
- 5 Best Resume Software Programs to Create the Perfect Resume
- Money Sources to Fund Your New Business Venture
- Boost Your Productivity While Working from Home
From Financial Trend Forecaster
- 4 Precious Metals to Consider
- The Future of Social Security Disability
- U.S. Develops New “Humanitarian” Missile That Doesn’t Kill People
- U.S.-China Trade War: Who will Win?
From Elliott Wave University
- Elliott Wave: Market Signaling Fed to Cut Rates Soon
- What Typically Happens When These Charts Flip?
- Are Rate Cuts a “Death Knell” for Stocks?
- Is War Good for Stocks?
From OptioMoney.com
- 3 Benefits of Finding a Reliable Family Lawyer
- 4 Hidden Car Costs
- Buying and Selling Ranch Land: A Beginner’s Guide
- 4 Tips to Cover the Bills When Your Disability Keeps You Home
From Your Family Finances
- Remodel Your Family Backyard and Save Some Money
- How to Teach Teens about Finances
- Tips to Afford a Home and Yard for a Small Family
- How to Prepare Your Budget for Big Purchases
- 4 Ways to Cut Back on Your Budget to Save for a Down Payment

Leave a Reply