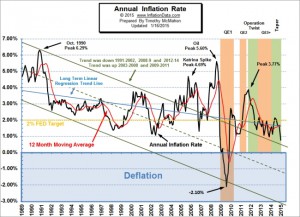
The U.S. Bureau of Labor Statistics (BLS) released the Consumer Price Index (CPI-U) data today for the month of January. The verdict was that inflation had fallen rapidly from 0.76% in December to a slightly deflationary -0.09% for the 12 months ending in January. This is the first time since 2009 that we have seen Annual deflation although there were several times during 2014 that we saw monthly deflation. Monthly deflation (annual disinflation) means that prices are slightly lower than they were last month but still higher than a year ago, which typically happens a few times every year (generally in the 4th quarter), but this year prices began falling during the summer, indicating … [Read more...]
Updated Inflation Adjusted Gasoline Price Chart
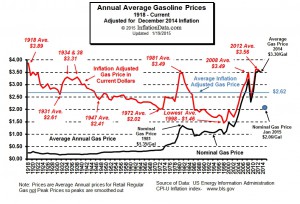
With the recent drop in gasoline prices perhaps you have begun to wonder exactly how close to historical lows are we? If so we have updated our famous Inflation Adjusted Gasoline Price Chart. It shows where we stand on an inflation adjusted basis. Lowest Inflation Adjusted Price of Gasoline was $1.46 in 1998 Back in 1918 gasoline was $0.25 a gallon and by 1932 prices had fallen to 18 cents a gallon! But as we all know over the last 100 years the purchasing power of the dollar has fallen drastically so in order to get the true picture we can’t just say that the lowest price of gas was 18 cents per gallon, we need to adjust the price for inflation. When adjusting for inflation there are … [Read more...]
Annual Inflation Below 1%
The U.S. Bureau of Labor Statistics released their monthly Consumer Price Index (CPI) data on Friday January 16th for December and for the first time since 2009 reported annual inflation below 1% (although we calculated October 2013 at 0.96%). The Consumer Price Index (CPI) for December was 234.812 down from November’s 236.151 which was also down from 237.433 for October. This resulted in a monthly decrease in prices of -0.57% and an annual inflation rate of 0.76%. Overall energy on a “seasonally adjusted” basis was down -4.7% for the month and -10.6% on an unadjusted basis for the entire year. Fuel oil fell -7.8% for the month (adjusted) and a whopping -19.1% annually. Gasoline was … [Read more...]
Bureau of Labor Statistics: Inflation Down
The U.S. Bureau of Labor Statistics released their monthly Consumer Price Index (CPI) data on Wednesday December 17th for November and reported lower inflation. The CPI for November was 236.151 down from 237.433 for October. This resulted in a monthly decrease in prices of -0.54% and an annual inflation rate of 1.32% down from 1.66% in October. View the chart and read the full commentary on the current annual inflation rate. Although the FED has been targeting a 2% annual inflation rate, rates are currently much lower and have often been considerably higher than 2% as well. The FED has hit their 2% target a total of 6 times out of more than 300 data points. If we count all the … [Read more...]
Crude Oil and Gold
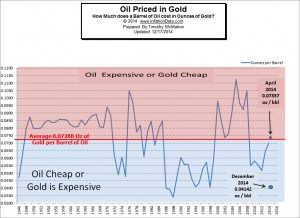
Because inflation decreases the value of of money, in order to have a “yard stick” of constant value it is necessary to use the inflation adjusted price when we consider the price of a commodity like Oil. Here at InflationData we have provided a variety of charts of the inflation adjusted price of commodities like Oil, Gasoline, Electricity, Natural Gas, Stock Market, Housing Prices, Education Costs and much more. But each of these requires you to rely on potentially flawed inflation statistics generated by some outside agency or government. If that agency has an agenda other than accuracy your cost estimates could be flawed. But there is an alternative and that is to compare your … [Read more...]
Could a Strong Dollar Actually Cause Problems?
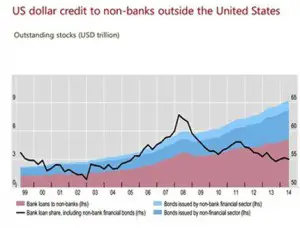
It seems that there is the possibility for danger no matter which way the economy goes. You would think that a strong dollar would be a good thing... after-all it allows us to buy things more cheaply on the global market. If our money goes further we are richer, oil is cheaper, imports cost less, etc. But the flip side is that our products are more expensive on the world market and so we export less. In today's article we look at the inherent risks of a strong dollar. ~Tim McMahon, editor. Outside the Box: How the Rising Dollar Could Trigger the Next Global Financial Crisis By John Mauldin This week’s Outside the Box continues with a theme that I and my colleague Worth Wray have been … [Read more...]
Japanese Superman Meets Economic Kryptonite
Abenomics: From Faith to Failure Why the biggest monetary stimulus effort in the world did NOT stop deflation in its tracks By Elliott Wave International When Shinzo Abe became the Prime Minister of Japan in December 2012, he was regarded with the kind of reverence that politicians dream about. He was featured in a hit pop song ("Abeno Mix"), hailed as a "samurai warrior," and featured on the May 2013 The Economist cover as none other than Superman. But in the two short years since, Abe as Superman has been struck down by the superpower-zapping force of economic kryptonite. On November 17, government reports confirmed that Japan's brief respite from a 20-year long entrenched … [Read more...]
Inflation Flat for October
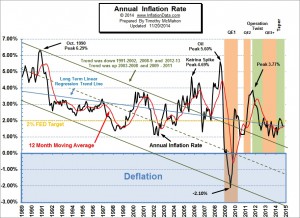
The Bureau of Labor Statistics released the Inflation rate for the month of October today. Annual inflation remained steady at 1.66% even though prices fell from the month previous (i.e. monthly inflation was -0.25%). However, since monthly inflation was -0.26% in October 2013 annual inflation rates remained virtually identical as October 2013 was replaced by October 2014 in the calculations. The FED has stated that it's goal is to maintain inflation at a steady 2%. But as we can see from the chart they have rarely achieved that goal. If the goal was to remain below 2% we could say they have done very well since 2012 however during that time-period the FED has been fearing deflation … [Read more...]
Deflation: The Last Argument of Central Banks
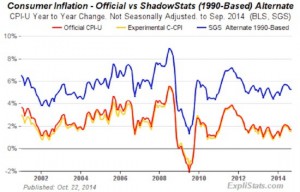
In today's article John Mauldin looks at "good" deflation vs. "bad" deflation, Austrian vs Monetarist vs Keynesian economics, causes of falling agricultural and manufactured goods prices, ShadowStats, hedonics, Asset Inflation Versus Price Inflation and more. ~Tim McMahon, editor Thoughts from the Frontline: The Last Argument of Central Banks By John Mauldin For a central banker, deflation is one of the Four Horsemen of the Apocalypse: Death, Famine, Disease, and Deflation. (We will address later in this letter why War, in the form of a currency war, is not in a central banker’s Apocalypse mix.) It is helpful to understand that, before a person is allowed to join the staff or board of a … [Read more...]
Inflation Down Again
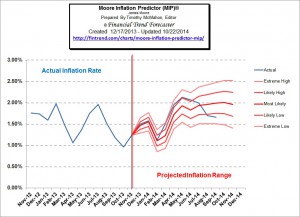
The Bureau of Labor Statistics (BLS) released the September inflation numbers on October 22nd and inflation is lower for the fourth month in a row. Annual inflation in May was 2.13% in June it was down to 2.07% (although the BLS rounded both to 2.1%). In July inflation fell to 1.99% and in August it was down to 1.70% and in September it was 1.66%. Once again the BLS rounded both August and September to 1.7%. The last few months are a perfect reason why it is important to use our two decimal place inflation calculations. So although we have seen a steady decline, using the BLS numbers you would see 2.1%, 2.1%, 2.0%, 1.7%, 1.7% and so the decline is not so obvious. As the inflation rate … [Read more...]

