• Home
  • Related Sites
    • Financial Trend Forecaster
      • Moore Inflation Predictor
      • NYSE Rate of Change (ROC)
      • NASDAQ Rate of Change (ROC)
      • Crypto ROC- BTC & ETH
    • Unemployment Data
      • Historical Employment Data
      • Unemployment Rate Chart
      • Labor Force Participation Rate
    • Optio Money
    • Elliott Wave University
    • More Resources
  • Definitions
    • What is Inflation?
    • What is Core Inflation?
    • Inflation vs CPI
    • What is Deflation?
    • What is Disinflation?
    • What is Agflation?
    • What is Stagflation?
    • What is Hyperinflation?
    • What is Quantitative Easing?
    • What is Quantitative Tightening?
    • What is Velocity of Money?
    • What is Fiat Currency?
    • How Do I Calculate Inflation?
    • What are “Sticky Prices” and Why Do They Matter?
  • Featured Content
  • About Us
  • Feedback
    • Sitemap
  • Subscribe Now

InflationData.com

Your Place in Cyber Space for Inflation Data

CPIWidget-Jan26
  • Numerical Inflation Data
    • Current Inflation Rate
    • Monthly Inflation Rate (Moved)
    • Historical U.S. Inflation Rates
    • Historical CPI
  • Inflation Charts
    • Ann. Inf. Rate Chart
    • Long Term Inflation >
      • Ave. Inf. by Decade
      • Total Inf. by Decade
      • Inflation 1913-1919
      • Inflation 1920-1929
      • Inflation 1930-1939
      • Inflation 1940-1949
      • Inflation 1950-1959
      • Inflation 1960-1969
      • Inflation 1970-1979
    • Cumulative Inflation
    • FED Monetary Policy and Inflation
    • Inflation and Recession
    • Confederate Inflation (1861 – 1865)
    • Misery Index
    • The 3 Stages of Inflation
    • 15-Yr Inflation Trends Chart
  • Inflation Calculators
    • Cumulative Inf. Calc.
    • How Much Would it Cost
    • Salary Inf. Calc.
    • Cost of Living Calc.
    • U.K. Inf. Calc.
    • Cost of Gas Calc.
    • Net Worth Calc.
    • Lifetime Earnings Calc.
    • Savings Goal Calc.
    • Financial Calculators
  • Inf. Adjusted Prices
    • Energy >
      • Inflation Adj. Gas Prices
      • Historical Oil Prices Chart
      • Crude Oil Price (Table)
      • Natural Gas Prices
      • Electricity Prices
      • Oil vs Gold
    • Gold >
      • Inflation Adjusted Annual Average Gold Prices
      • Gold is a “Crisis Hedge” not an  “Inflation Hedge”
      • Comparing Oil vs. Gold
    • Corn Prices
    • Education Inflation
    • Housing Prices
    • Mortgage Rates
    • NYSE Index
    • Inf. Indexed Bonds
    • Movie Revenues
    • Inflation-Adjusted Wages
  • Cost of Living
    • Calculate Cost of Living
    • Cost-of-living Adj. (COLA)
    • Consumer Price Index CPI
      • Historical CPI
      • Current CPI
      • CPI Release Dates
    • Gas Prices >
      • Cost of Gas
      • Cost of Gas Per Month
      • Gas vs. Oil Price Chart
    • Food Prices 1913 vs 2013
    • Health Insurance
  • Blog
    • Key Inflation Articles
    • International Inflation
    • Historical Inflation Rates for Japan (1971 to 2014)
You are here: Home » Blog » General » Inflation Flat for October

Inflation Flat for October

Published on November 20, 2014 by Tim McMahon Leave a Comment

The Bureau of Labor Statistics released the Inflation rate for the month of October today. Annual inflation remained steady at 1.66% even though prices fell from the month previous (i.e. monthly inflation was -0.25%). However, since monthly inflation was -0.26% in October 2013 annual inflation rates remained virtually identical as October 2013 was replaced by October 2014 in the calculations.

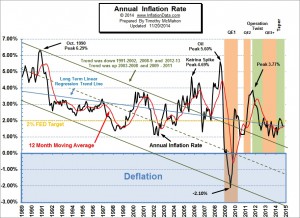
The FED has stated that it’s goal is to maintain inflation at a steady 2%. But as we can see from the chart they have rarely achieved that  goal. If the goal was to remain below 2% we could say they have done very well since 2012 however during that time-period the FED has been fearing deflation rather than inflation and so even by though trillions have been earmarked as quantitative easing, quite often inflation has fallen well below 2% and often down to 1%.

Annual_Inflation_chartIn our recent article Deflation: The Last Argument of Central Banks John Mauldin looked at “good” deflation vs. “bad” deflation, Austrian vs Monetarist vs Keynesian economics, causes of falling agricultural and manufactured goods prices, ShadowStats, hedonics, Asset Inflation Versus Price Inflation and more.

Over the last few months inflation has been relatively stable and according to the single digit calculations of the Bureau of Labor Statistics (BLS) they have actually been identical several of those months But using our two decimal place inflation calculations we get a slightly different picture. Using the BLS numbers for May through October you would see 2.1%, 2.1%, 2.0%, 1.7%, 1.7%, 1.7% and so a trend is not so obvious.  But by looking at our 2 decimal place calculations we see May was 2.13% followed by 2.07%, 1.99%, 1.70%, 1.66% and finally October was also 1.66% so we see a steady decline.

As the inflation rate falls this is “disinflation” on an annual basis although July, August and October were “deflationary” on a monthly basis, i.e. each monthly number was below zero at -0.04%, -0.17%, -0.25% respectively.

Looking at the most recent two months… although they appear identical at first glance, they are not if we look at the components that make them up . From the table below we can see that over the 12 months prior both September and October have a total of 1.66% inflation but over the most recent 6  months the October values have only 0.15% inflation compared to 1.76% in September. Basically all of the inflation for the previous 12 months occurred from January through June of 2014.  And a good chunk of it… 0.64% actually occurred in March. If you look at the table below you will see that in the most recent four months prices fell by -0.38% and November and December are notoriously deflationary.  So unless we have another massively inflationary first half of 2015 inflation could rapidly turn to deflation and we could see the FED crank up the printing presses once again.

Month Sep-14 Oct-14
Index 238.031 237.433
12 Month Change 1.66% 1.66%
10 Month Change 2.13% 1.88%
8 Month Change 1.76% 1.13%
6 Month Change 0.74% 0.15%
4 Month Change 0.06% -0.38%
2 Month Change -0.09% -0.18%
1 Month Change 0.08% -0.25%

Recently we published an article by Bill Bonner entitled More Quantitative Easing in the Cards? Which shows that FED is addicted to Quantitative Easing (QE) and that it wouldn’t be so easy to kick the  habit. Over the years we’ve published a variety of articles on the inherent “tug-of-war” between inflationary and deflationary forces in the world.

Including:

  • How can we have Inflation and Deflation at the same time?
  • Battle of the ‘Flations
  • Deflation or Inflation – Which is it?
  • Which is Stronger- Inflation or Deflation?
  • Inflation or Deflation? – Yes

Another recurring theme has been Velocity of Money and Money Multiplier- Why Deflation is Possible

About Tim McMahon

Connect with Tim on Google+.

  • Web
  • |
  • Twitter
  • |
  • Facebook
  • |
  • LinkedIn
  • |
  • More Posts(408)

Filed Under: General Tagged With: deflation, inflation

Leave a Reply Cancel reply

Your email address will not be published. Required fields are marked *

This site uses Akismet to reduce spam. Learn how your comment data is processed.

Latest Posts

  • Updated Cumulative Inflation Calculator
  • Inflation-Adjusted Silver Prices
  • December Inflation Down Slightly, Not Flat
  • December 2025 Inflation Report for November
  • How Deflation Created the Middle Class
  • October Inflation Numbers Delayed
  • Why the 2.8% COLA May Fall Short of Real Inflation
  • Delayed BLS September Inflation Data Released

Sponsored:

As a Seasoned Investor I thought I'd seen everything... But recently I discovered TradingView which has really improved the information I have at my fingertips.~ Tim McMahon, editor

TradingView gives me an edge... including powerful charting tools, real-time market data, and a global community of traders—all in one easy to use platform. It has hundreds of indicators, and even custom scripts for more advanced users, and you don't need to change Brokers just use its seamless brokerage integration... TradingView isn't just a charting tool—it's your full trading command center.

Trade smarter. Trade faster. Check Out TradingView for free.

----------

The Best Place to Buy Your Crypto

Coinbase is the largest Crypto Trading platform in the U.S. and the easiest to use. ~Tim McMahon, editor

Check out Coinbase here

Subscribe Now

eTrends Signup Form

Elliott Wave Resources

Free Elliott Wave Resources

What is Waveopedia?

Waveopedia is EWI’s free, comprehensive index of Elliott wave patterns and terms. Everyone from beginners to experts can benefit from it. It’s a great place to send your followers if they’re new to Elliott waves.

  • Deflation Hits China is the U.S. Next?

  • Why You Must Avoid the Herding Trap

  • Chasing Trends Can Cost You

  • More Education Resources

Post Archives

Home | Articles | Sitemap | Terms of Service | Privacy | Disclaimer | Advertise With Us

Copyright © 1996-2026 · Capital Professional Services, LLC · Maintained by Design Synergy Studio · Admin

Do Not Sell My Personal Information