• Home
  • Related Sites
    • Financial Trend Forecaster
      • Moore Inflation Predictor
      • NYSE Rate of Change (ROC)
      • NASDAQ Rate of Change (ROC)
      • Crypto ROC- BTC & ETH
    • Unemployment Data
      • Historical Employment Data
      • Unemployment Rate Chart
      • Labor Force Participation Rate
    • Optio Money
    • Elliott Wave University
    • More Resources
  • Definitions
    • What is Inflation?
    • What is Core Inflation?
    • Inflation vs CPI
    • What is Deflation?
    • What is Disinflation?
    • What is Agflation?
    • What is Stagflation?
    • What is Hyperinflation?
    • What is Quantitative Easing?
    • What is Quantitative Tightening?
    • What is Velocity of Money?
    • What is Fiat Currency?
    • How Do I Calculate Inflation?
    • What are “Sticky Prices” and Why Do They Matter?
  • Featured Content
  • About Us
  • Feedback
    • Sitemap
  • Subscribe Now

InflationData.com

Your Place in Cyber Space for Inflation Data

CPIWidget-Feb26
  • Numerical Inflation Data
    • Current Inflation Rate
    • Monthly Inflation Rate (Moved)
    • Historical U.S. Inflation Rates
    • Historical CPI
  • Inflation Charts
    • Ann. Inf. Rate Chart
    • Long Term Inflation >
      • Ave. Inf. by Decade
      • Total Inf. by Decade
      • Inflation 1913-1919
      • Inflation 1920-1929
      • Inflation 1930-1939
      • Inflation 1940-1949
      • Inflation 1950-1959
      • Inflation 1960-1969
      • Inflation 1970-1979
    • Cumulative Inflation
    • FED Monetary Policy and Inflation
    • Inflation and Recession
    • Confederate Inflation (1861 – 1865)
    • Misery Index
    • The 3 Stages of Inflation
    • 15-Yr Inflation Trends Chart
  • Inflation Calculators
    • Cumulative Inf. Calc.
    • How Much Would it Cost
    • Salary Inf. Calc.
    • Cost of Living Calc.
    • U.K. Inf. Calc.
    • Cost of Gas Calc.
    • Net Worth Calc.
    • Lifetime Earnings Calc.
    • Savings Goal Calc.
    • Financial Calculators
  • Inf. Adjusted Prices
    • Energy >
      • Inflation Adj. Gas Prices
      • Historical Oil Prices Chart
      • Crude Oil Price (Table)
      • Natural Gas Prices
      • Electricity Prices
      • Oil vs Gold
    • Gold >
      • Inflation Adjusted Annual Average Gold Prices
      • Gold is a “Crisis Hedge” not an  “Inflation Hedge”
      • Comparing Oil vs. Gold
    • Corn Prices
    • Education Inflation
    • Housing Prices
    • Mortgage Rates
    • NYSE Index
    • Inf. Indexed Bonds
    • Movie Revenues
    • Inflation-Adjusted Wages
  • Cost of Living
    • Calculate Cost of Living
    • Cost-of-living Adj. (COLA)
    • Consumer Price Index CPI
      • Historical CPI
      • Current CPI
      • CPI Release Dates
    • Gas Prices >
      • Cost of Gas
      • Cost of Gas Per Month
      • Gas vs. Oil Price Chart
    • Food Prices 1913 vs 2013
    • Health Insurance
  • Blog
    • Key Inflation Articles
    • International Inflation
    • Historical Inflation Rates for Japan (1971 to 2014)
You are here: Home » Blog » Uncategorized » Inflation Down Again

Inflation Down Again

Published on October 23, 2014 Updated on March 31, 2021 by Tim McMahon Leave a Comment

The Bureau of Labor Statistics (BLS) released the September inflation numbers on October 22nd and inflation is lower for the fourth  month in a row. Annual inflation in May was 2.13% in June it was down to 2.07% (although the BLS rounded both to 2.1%). In July inflation fell to 1.99% and in August it was down to 1.70% and in September it was 1.66%. Once again the BLS rounded both August and September to 1.7%.

The last few months are a perfect  reason why it is important to use our two decimal place inflation calculations. So although we have seen a steady decline, using the BLS numbers you would see 2.1%, 2.1%, 2.0%, 1.7%, 1.7% and so the decline is not so obvious.   As the inflation rate falls this is “disinflation” on an annual basis although July and August were “deflationary” on a monthly basis, i.e. each monthly number was below zero at -0.04% and -0.17% respectively.

Our Moore Inflation Predictor (MIP) is generally quite accurate. Last month we predicted a slight decrease in inflation for September in the range of 1.52% to 1.64% with the actual inflation rate turning out to be 1.66%.  This month’s MIP is projecting that inflation will be down for October with a downward bias through June 2015. See the full commentary and the current chart here.

Here is a sample of how well the MIP performed. This chart is the projection from December 2013 with the blue reality line extended through September.

Mip-reality-Dec-2013a

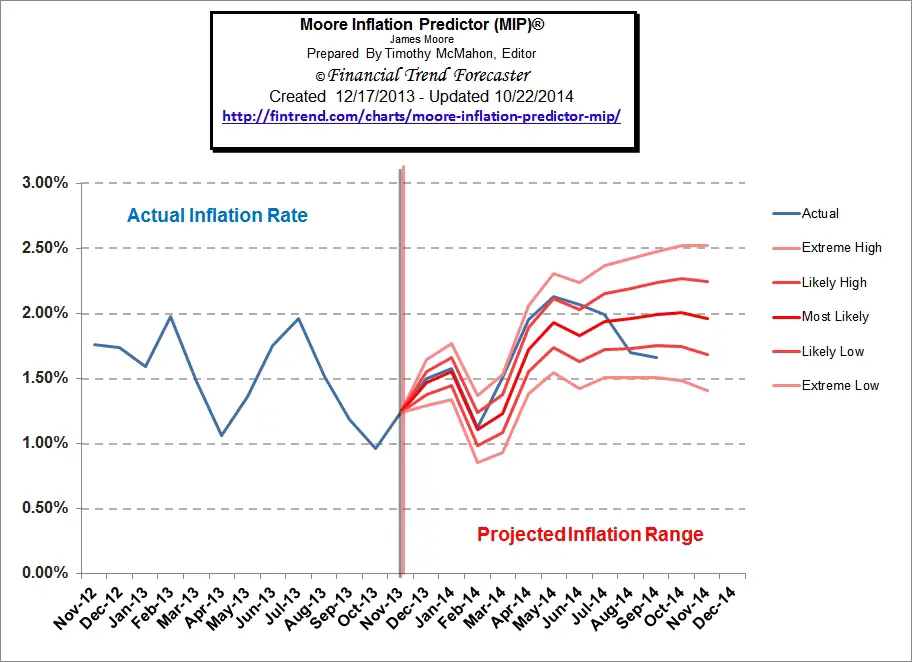
As you can see the blue line tracks the most likely line for several months and then moves to the high side before returning to the center.

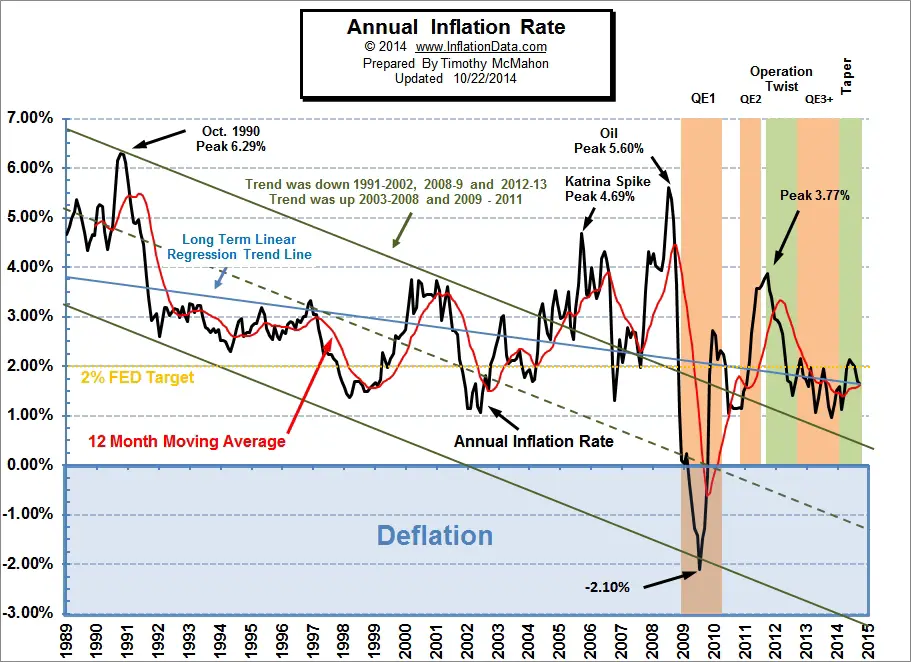
In our Current Annual Inflation Commentary we include the following chart:

Annual_Inflation_chart

Excerpt:

Annual inflation for the 12 months ending in September 2014 was 1.66%.  This is down slightly from 1.70% in August, 1.99% in July,  2.07% in June and 2.13% in May .

This month we’ve added a 2% dotted line to the chart to signify the FED “target”. According to policy the FED is targeting a 2% inflation rate. As we can see from the chart over the last 25 years they have come close to the target a total of 6 times out of more than 300. If we count all the times they crossed the target or even got close we get a total of maybe 25 total. Or about 8% of the the time. Not an exceptionally good track record.

Overall energy on a “seasonally adjusted” basis was down -0.7% for the month and -0.6% on an unadjusted basis for the entire year.  Fuel oil fell -2.1%  for the month (adjusted). On an annual basis electricity rose 2.8% but on a monthly basis it fell -0.7%. Gasoline fell -1.0% and Natural gas rose 1.6% for the month.

There are signs of a possible new top in Real Estate see:  Another Housing Bust On The Way?

And a major economic factor on the horizon is the Death of the Petrodollar and an interesting article by John Mauldin called Inflation or Deflation? – Yes which looks at how the Velocity of Money is leading to deflation.

You might also enjoy:

  • Gasoline vs. Crude Oil Prices Chart
  • What’s so bad about deflation?
  • Historical Oil Prices Chart
  • Inflation Adjusted Gasoline Prices
  • Various Methods of Calculating Inflation
  • Annual Inflation Rate Chart

About Tim McMahon

Connect with Tim on Google+.

  • Web
  • |
  • Twitter
  • |
  • Facebook
  • |
  • LinkedIn
  • |
  • More Posts(409)

Filed Under: Uncategorized

Leave a Reply Cancel reply

Your email address will not be published. Required fields are marked *

This site uses Akismet to reduce spam. Learn how your comment data is processed.

Latest Posts

  • BLS Inflation Data Delayed
  • Updated Cumulative Inflation Calculator
  • Inflation-Adjusted Silver Prices
  • December Inflation Down Slightly, Not Flat
  • December 2025 Inflation Report for November
  • How Deflation Created the Middle Class
  • October Inflation Numbers Delayed
  • Why the 2.8% COLA May Fall Short of Real Inflation

Sponsored:

As a Seasoned Investor I thought I'd seen everything... But recently I discovered TradingView which has really improved the information I have at my fingertips.~ Tim McMahon, editor

TradingView gives me an edge... including powerful charting tools, real-time market data, and a global community of traders—all in one easy to use platform. It has hundreds of indicators, and even custom scripts for more advanced users, and you don't need to change Brokers just use its seamless brokerage integration... TradingView isn't just a charting tool—it's your full trading command center.

Trade smarter. Trade faster. Check Out TradingView for free.

----------

The Best Place to Buy Your Crypto

Coinbase is the largest Crypto Trading platform in the U.S. and the easiest to use. ~Tim McMahon, editor

Check out Coinbase here

Subscribe Now

eTrends Signup Form

Elliott Wave Resources

Free Elliott Wave Resources

What is Waveopedia?

Waveopedia is EWI’s free, comprehensive index of Elliott wave patterns and terms. Everyone from beginners to experts can benefit from it. It’s a great place to send your followers if they’re new to Elliott waves.

  • Deflation Hits China is the U.S. Next?

  • Why You Must Avoid the Herding Trap

  • Chasing Trends Can Cost You

  • More Education Resources

Post Archives

Home | Articles | Sitemap | Terms of Service | Privacy | Disclaimer | Advertise With Us

Copyright © 1996-2026 · Capital Professional Services, LLC · Maintained by Design Synergy Studio · Admin

Do Not Sell My Personal Information