• Home
  • Related Sites
    • Financial Trend Forecaster
      • Moore Inflation Predictor
      • NYSE Rate of Change (ROC)
      • NASDAQ Rate of Change (ROC)
      • Crypto ROC- BTC & ETH
    • Unemployment Data
      • Historical Employment Data
      • Unemployment Rate Chart
      • Labor Force Participation Rate
    • Optio Money
    • Elliott Wave University
    • More Resources
  • Definitions
    • What is Inflation?
    • What is Core Inflation?
    • Inflation vs CPI
    • What is Deflation?
    • What is Disinflation?
    • What is Agflation?
    • What is Stagflation?
    • What is Hyperinflation?
    • What is Quantitative Easing?
    • What is Quantitative Tightening?
    • What is Velocity of Money?
    • What is Fiat Currency?
    • How Do I Calculate Inflation?
    • What are “Sticky Prices” and Why Do They Matter?
  • Featured Content
  • About Us
  • Feedback
    • Sitemap
  • Subscribe Now

InflationData.com

Your Place in Cyber Space for Inflation Data

CPIWidget-Jan26
  • Numerical Inflation Data
    • Current Inflation Rate
    • Monthly Inflation Rate (Moved)
    • Historical U.S. Inflation Rates
    • Historical CPI
  • Inflation Charts
    • Ann. Inf. Rate Chart
    • Long Term Inflation >
      • Ave. Inf. by Decade
      • Total Inf. by Decade
      • Inflation 1913-1919
      • Inflation 1920-1929
      • Inflation 1930-1939
      • Inflation 1940-1949
      • Inflation 1950-1959
      • Inflation 1960-1969
      • Inflation 1970-1979
    • Cumulative Inflation
    • FED Monetary Policy and Inflation
    • Inflation and Recession
    • Confederate Inflation (1861 – 1865)
    • Misery Index
    • The 3 Stages of Inflation
    • 15-Yr Inflation Trends Chart
  • Inflation Calculators
    • Cumulative Inf. Calc.
    • How Much Would it Cost
    • Salary Inf. Calc.
    • Cost of Living Calc.
    • U.K. Inf. Calc.
    • Cost of Gas Calc.
    • Net Worth Calc.
    • Lifetime Earnings Calc.
    • Savings Goal Calc.
    • Financial Calculators
  • Inf. Adjusted Prices
    • Energy >
      • Inflation Adj. Gas Prices
      • Historical Oil Prices Chart
      • Crude Oil Price (Table)
      • Natural Gas Prices
      • Electricity Prices
      • Oil vs Gold
    • Gold >
      • Inflation Adjusted Annual Average Gold Prices
      • Gold is a “Crisis Hedge” not an  “Inflation Hedge”
      • Comparing Oil vs. Gold
    • Corn Prices
    • Education Inflation
    • Housing Prices
    • Mortgage Rates
    • NYSE Index
    • Inf. Indexed Bonds
    • Movie Revenues
    • Inflation-Adjusted Wages
  • Cost of Living
    • Calculate Cost of Living
    • Cost-of-living Adj. (COLA)
    • Consumer Price Index CPI
      • Historical CPI
      • Current CPI
      • CPI Release Dates
    • Gas Prices >
      • Cost of Gas
      • Cost of Gas Per Month
      • Gas vs. Oil Price Chart
    • Food Prices 1913 vs 2013
    • Health Insurance
  • Blog
    • Key Inflation Articles
    • International Inflation
    • Historical Inflation Rates for Japan (1971 to 2014)
You are here: Home » Blog » Cost of Living » Regarding Gas Inflation

Regarding Gas Inflation

Published on April 22, 2013 Updated on August 24, 2015 by Tim McMahon 1 Comment

Doug S. Says I’m full of It- Regarding Gas Inflation

I just got the following comment from Doug S.

I saw the chart on how gas prices haven’t really risen when considered with inflation. I am 61 years old, and when I was working in the mid- to late-60s as a high school student, I made $1.60 an hour as minimum wage. Gas was only .25-.35 per gallon (with ‘gas wars’, much of the time cheaper) so with one hour of work I could purchase 5-6 gallons of gas. Now, with a minimum wage of $7.50 or so, you can only purchase a bit more than 2 gallons of gas, depending on the day of the week. Minimum wage has gone up, what, 4.6-5 times or so, but gas prices have gone up 10 times or more. Where am I missing the point???

Based on what I have read, a loaf of bread might have gone up 5-6 times. I do know that you can use figures to make any point you want, but I am not convinced that gas is matching inflation and is ‘less or about the same’ inflated price as it was 40 or 50 years ago. This is garbage. ~ Doug S.

 Inflation Adjusted Gas Prices

My response:

Doug,

I don’t recall saying that gas is currently cheap or that it is less or about the same as 50 years ago. Although it is about the same as 1918.

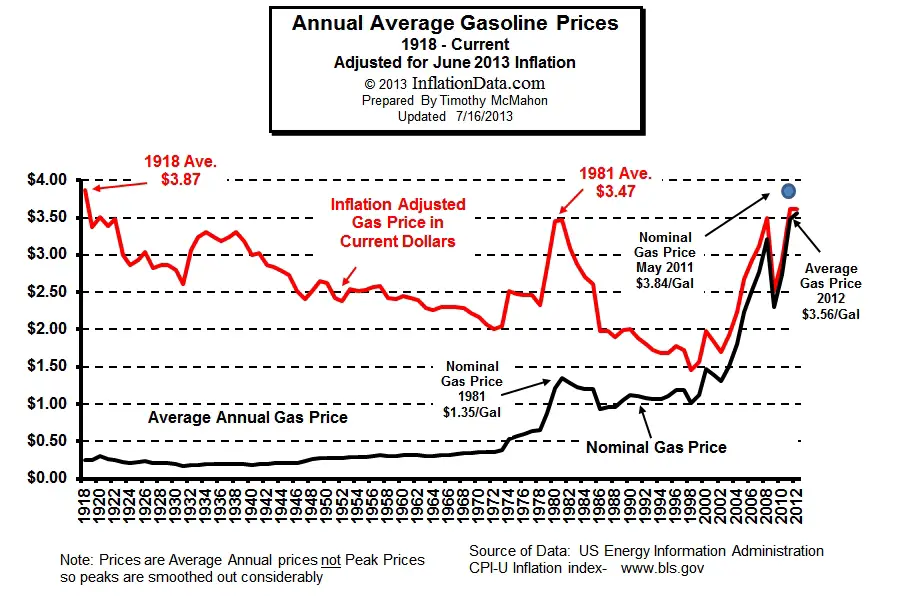
If you look at the chart you will see that gas prices in inflation adjusted terms were at one of their lowest points in the 1960’s declining from $2.50 in 2013 dollars in 1960 down to $2.00 in 1970 during the gas price wars that you mentioned. So compared to that specific time-frame, yes prices have increased significantly. However, in 2000, when the inflation adjusted price was only $1.50  you could just as well have said that prices have declined since 1960.

What I said was, most people use a fairly short term perspective of only the most recent few years and so things look especially bad right now because prices have risen drastically since 2000. But if you compare prices to 1918, 1981 or 2008 we are currently near those peak levels. I also said that the average price from 1918 through 2013 was $2.56 (in 2013 dollars) and so anytime gas prices were above that level it is expensive (now) and anytime it was below that level gas was cheap in historical terms (i.e. 1960 -1970 and 1986-2002).

As far as your argument regarding minimum wage, although interesting in a practical sense, it is based on a faulty premise. That is that the minimum wage is somehow related to real prices. The minimum wage is an arbitrary construct of the government based on political posturing. Congress can set it at anything it wants to and only changes it sporadically, so at any given time it could be too high or too low compared to inflation. If tomorrow the government mandated that the minimum wage was $20 would that mean that gasoline is now cheap in historical terms?  What if the economy is doing well and even McDonald’s has to pay more than minimum wage in order to attract workers? How does that affect your argument regarding the price of  gas? No, in historical terms gasoline is still expensive whenever it is above $2.56 a gallon in 2013 adjusted dollars and cheap when it is below.

If you wish to compare prices to purchasing power, a better measure would be average income or median household income because they are based on actual market based prices rather than on an artificial government construct.  ~Tim McMahon, editor

To see the full article that triggered Doug’s question go to Gas Inflation .

See Also:

  • Gasoline 20 Cents a Gallon? Gasoline vs Silver
  • Gasoline vs. Oil Price Chart
  • Cost of Living Calculator
  • Cost of Living: How Much of Your Budget Goes to Food?
  • Inflation Adjusted Gasoline Prices
  • Gasoline vs. Crude Oil Prices
  • Historical Gas Price Chart
  • Current Average Cost of Gas by County
  • Gasoline Taxes by State
  • Average Cost of Gas Per Month
  • Calculating Miles Per Gallon
  • Historical Oil Prices Chart
  • Gasoline Rewards Credit Cards
  • More Inflation Adjusted Prices

Recommended by Amazon:

  • Gas Price Inflation Gasoline– Pictures of old Gas Pumps etc.
  • $20 Per Gallon: The Inevitable Rise in the Price of Gasoline
  • Inflation-Proof Your Portfolio: How to Protect Your Money from the Coming Government Hyperinflation
  • The Inflation Deception: Six Ways Government Tricks Us…and Seven Ways to Stop It!

About Tim McMahon

Connect with Tim on Google+.

  • Web
  • |
  • Twitter
  • |
  • Facebook
  • |
  • LinkedIn
  • |
  • More Posts(408)

Filed Under: Cost of Living, Inflation Tagged With: Gasoline Inflation

Comments

  1. Farleyagain says

    May 19, 2013 at 5:50 pm

    If gas prices are actually reflecting real inflation, why aren’t I getting at least twice as much in Social Security (I am just full retirement age)? By my calculations, I should be getting at least that much.

    Reply

Leave a Reply Cancel reply

Your email address will not be published. Required fields are marked *

This site uses Akismet to reduce spam. Learn how your comment data is processed.

Latest Posts

  • Updated Cumulative Inflation Calculator
  • Inflation-Adjusted Silver Prices
  • December Inflation Down Slightly, Not Flat
  • December 2025 Inflation Report for November
  • How Deflation Created the Middle Class
  • October Inflation Numbers Delayed
  • Why the 2.8% COLA May Fall Short of Real Inflation
  • Delayed BLS September Inflation Data Released

Sponsored:

As a Seasoned Investor I thought I'd seen everything... But recently I discovered TradingView which has really improved the information I have at my fingertips.~ Tim McMahon, editor

TradingView gives me an edge... including powerful charting tools, real-time market data, and a global community of traders—all in one easy to use platform. It has hundreds of indicators, and even custom scripts for more advanced users, and you don't need to change Brokers just use its seamless brokerage integration... TradingView isn't just a charting tool—it's your full trading command center.

Trade smarter. Trade faster. Check Out TradingView for free.

----------

The Best Place to Buy Your Crypto

Coinbase is the largest Crypto Trading platform in the U.S. and the easiest to use. ~Tim McMahon, editor

Check out Coinbase here

Subscribe Now

eTrends Signup Form

Elliott Wave Resources

Free Elliott Wave Resources

What is Waveopedia?

Waveopedia is EWI’s free, comprehensive index of Elliott wave patterns and terms. Everyone from beginners to experts can benefit from it. It’s a great place to send your followers if they’re new to Elliott waves.

  • Deflation Hits China is the U.S. Next?

  • Why You Must Avoid the Herding Trap

  • Chasing Trends Can Cost You

  • More Education Resources

Post Archives

Home | Articles | Sitemap | Terms of Service | Privacy | Disclaimer | Advertise With Us

Copyright © 1996-2026 · Capital Professional Services, LLC · Maintained by Design Synergy Studio · Admin

Do Not Sell My Personal Information