Inflation Summary:
- Annual Inflation up from 1.68% in February to 2.62% in March.
- CPI Index rose slightly from 263.014 in February to 264.877 in March.
- Monthly Inflation for February was 0.55% and March was 0.71%.
- Next release May 12th
Annual inflation for the 12 months ending in March was 2.62%
We have been predicting Annual Inflation would shoot up in March due to higher gas prices and negative numbers falling out of the annual calculation. Further increases to come in April and May.
Since the BLS rounds their numbers to 1 decimal place they reported February as 1.7% and March as 2.6% for a monthly increase of 9/10ths of 1% taking inflation well above the FED’s 2% target rate.
Due to the Saudi/Russia oil price war and the Corona Virus, March and April 2020 were -0.22% and -0.67% respectively resulting in a massive disinflationary environment. So far the smaller one has fallen out of the calculation. Next month when the larger one falls out of the Annual inflation equation, we can expect another massive jump in the annual inflation rate. If for instance April 2021 comes in at only 0.33% that would take the annual inflation rate up to 3.62%. If however, April is like March and we see 0.71%, we could see April’s Annual inflation at nearly 4% (i.e. ABOVE the September 2011 peak… see chart below).
BLS Commissioner’s Inflation Report:
“The Consumer Price Index for All Urban Consumers (CPI-U) increased 0.6 percent in March on a seasonally adjusted basis after rising 0.4 percent in February, the U.S. Bureau of Labor Statistics reported today. The March 1-month increase was the largest rise since a 0.6-percent increase in August 2012. Over the last
12 months, the all items index increased 2.6 percent before seasonal adjustment.
The gasoline index continued to increase, rising 9.1 percent in March and accounting for nearly half of the seasonally adjusted increase in the all items index. The natural gas index also rose, contributing to a 5.0-percent increase in the energy index over the month. The food index rose 0.1 percent in March, with the food at home index and the food away from home index both also rising 0.1 percent.
The all items index rose 2.6 percent for the 12 months ending March, a much larger increase than the 1.7-percent reported for the period ending in February.”
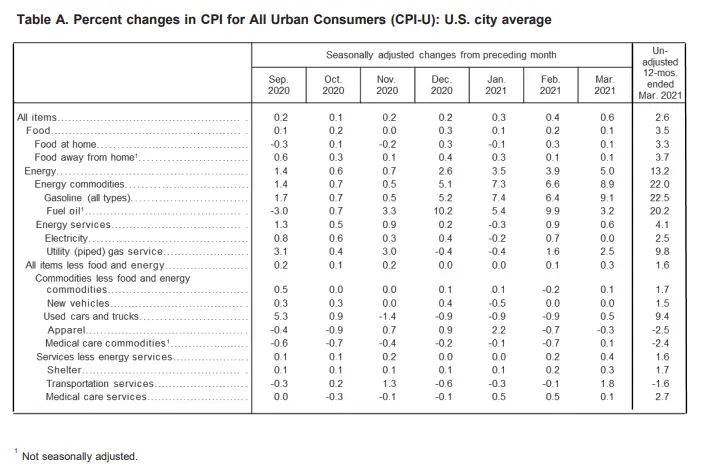
When we measure it to two decimals (on a non-adjusted basis) monthly inflation was 0.71% in March and annual inflation was 2.62% rather than 2.6%. Key components are the increase in Energy prices which increased 5.0% over the last month and 13.2% over the year. However, much of the energy increase was because there was a major drop a year ago due to the oil price crash and COVID. For more information see the price changes in various components of the Consumer Price Index over the last 20 years.
Seasonally Adjusted Inflation Components Table
Annual Inflation Chart:
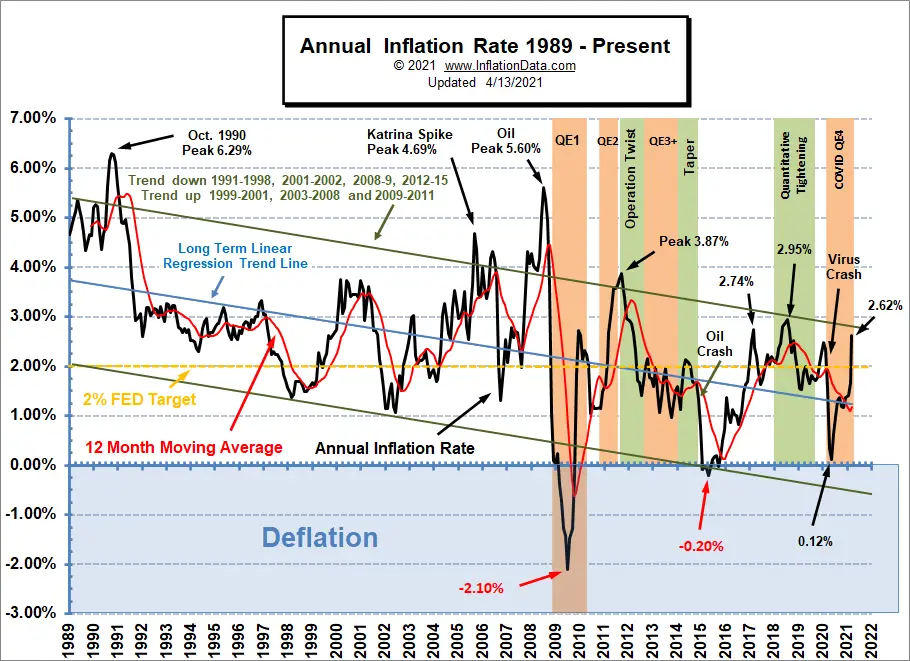
Annual inflation nears the top of the channel and exceeds the levels of January 2020 (just before the crash). Inflation will be spiking higher for the next couple of months as more extremely low numbers fall out of the calculation.
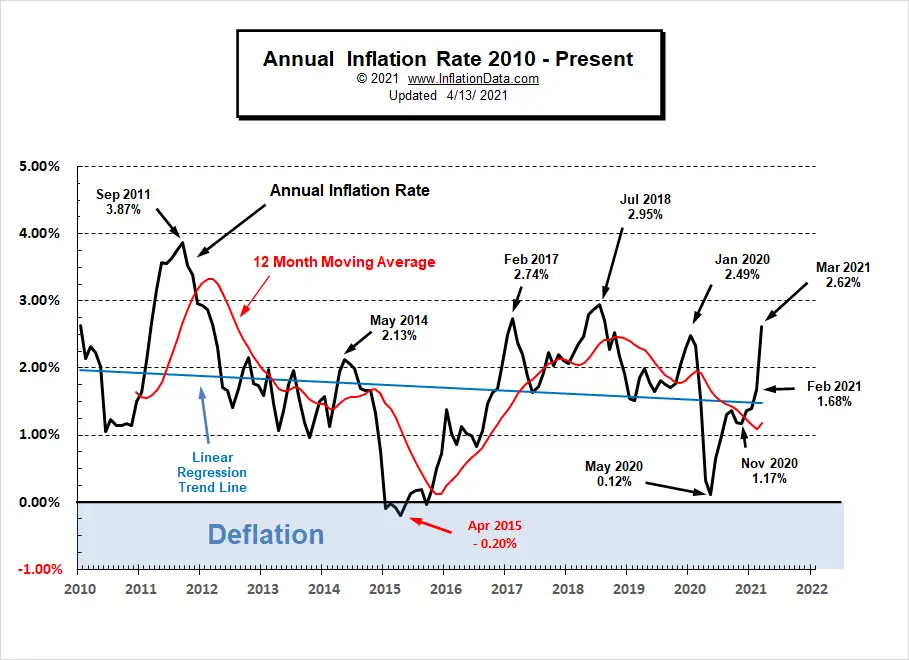
Current Inflation Situation
Looking at just the most recent 10 years we can easily see the higher March levels compared to January 2020.
Moore Inflation Predictor (MIP)
In this month’s MIP we have changed the projection due to the FED’s pronouncements. FED chairman Jerome Powell insists that inflation will not be a problem. So this month rather than using the extreme high (winter months projection numbers) we’ve been using we are switching back to “normal” Summer and Fall projections. April will still be high but if Summer numbers are normal as the FED projects, then as last year’s excessively high rebound numbers fall out of the calculation we will see sort of the opposite of what we saw in March and April and inflation will trend back toward normal.
See: Moore Inflation Predictor for current info
Not Seasonally Adjusted Monthly Inflation Rates
Monthly inflation for June was 0.55% comprising the majority of the annual inflation since March and April’s deflation canceled out much of the rest of the year’s inflation and now in February, we got another 0.55%.
| Jan | Feb | Mar | Apr | May | Jun | Jul | Aug | Sep | Oct | Nov | Dec | |
| 2016 | 0.17% | 0.08% | 0.43% | 0.47% | 0.41% | 0.33% | (0.16%) | 0.09% | 0.24% | 0.12% | (0.16%) | 0.03% |
| 2017 | 0.58% | 0.31% | 0.08% | 0.30% | 0.09% | 0.09% | (0.07%) | 0.30% | 0.53% | (0.06%) | 0.002% | (0.06%) |
| 2018 | 0.54% | 0.45% | 0.23% | 0.40% | 0.42% | 0.16% | 0.01% | 0.06% | 0.12% | 0.18% | (0.33%) | (0.32%) |
| 2019 | 0.19% | 0.42% | 0.56% | 0.53% | 0.21% | 0.02% | 0.17% | (0.01%) | 0.08% | 0.23% | (0.05%) | (0.09%) |
| 2020 | 0.39% | 0.27% | (0.22%) | (0.67%) | 0.002% | 0.55% | 0.51% | 0.32% | 0.14% | 0.04% | (0.06%) | 0.09% |
| 2021 | 0.43% | 0.55% | 0.71% |
See: Monthly Inflation Rate for more information and a complete table of Unadjusted Monthly Rates.
For more information See Annual Inflation.
Federal Reserve Actions
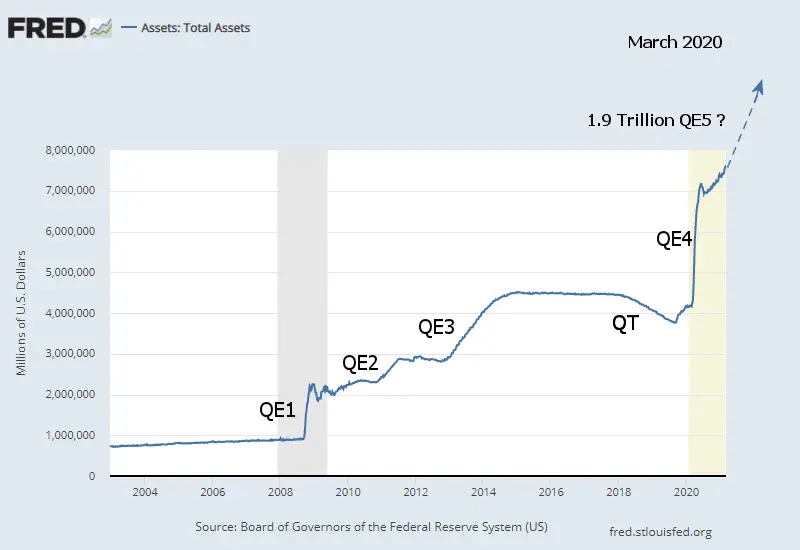
In the following chart, we see the Federal Reserve Total Assets have gradually increased over the last few months after a decrease in assets (QT) from June 10th through July 8th 2020. From there it gradually increased through much of the remainder of 2020 and into 2021. And the FED says they have no plans to stop any time soon. Quantitative Easing is like the Crack Cocaine of the stock market because you always need more to get a new high. And even a slight reduction brings the market down. Obviously, it can’t go on forever but like all politicians, the FED just wants to kick the can down the road a little further. And so we are seeing the latest injection.
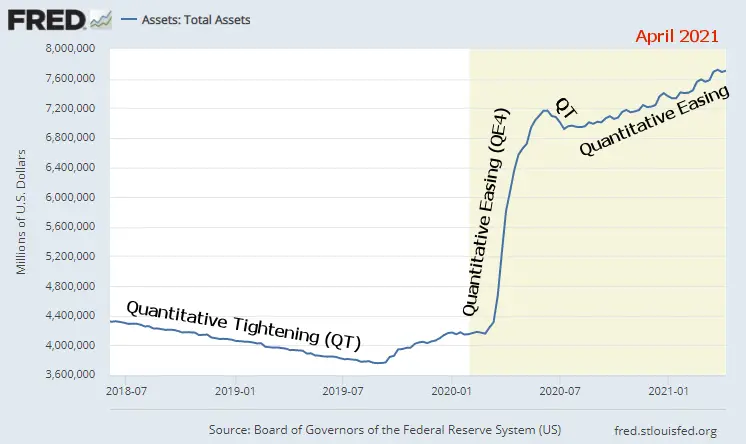
To put this in perspective we need to look a bit further back. Currently, FED assets are roughly 7.6 Trillion, an addition of 1.9 Trillion would take them to roughly 9.5 Trillion.
Up until 2008 FED assets never exceeded 1 Trillion then they decided to bail out the stock market, so they invented Quantitative Easing and increased FED assets by roughly 1.2 Trillion with QE1. QE2 brought total assets up to almost 3 Trillion. QE 3 added another 1.5 Trillion bringing total assets up to about 4.5 Trillion. Quantitative tightening brought assets back down to 3.7 Trillion but tanked the stock market taking the NYSE from 13,605 on January 29, 2018, to 10,976 on December 24, 2018 for a loss of roughly 19.3%. So if a decrease in FED assets of 0.8 Trillion can cause the market to lose 19% what will an increase of 1.9 Trillion do to the market?
FED Funds Rate
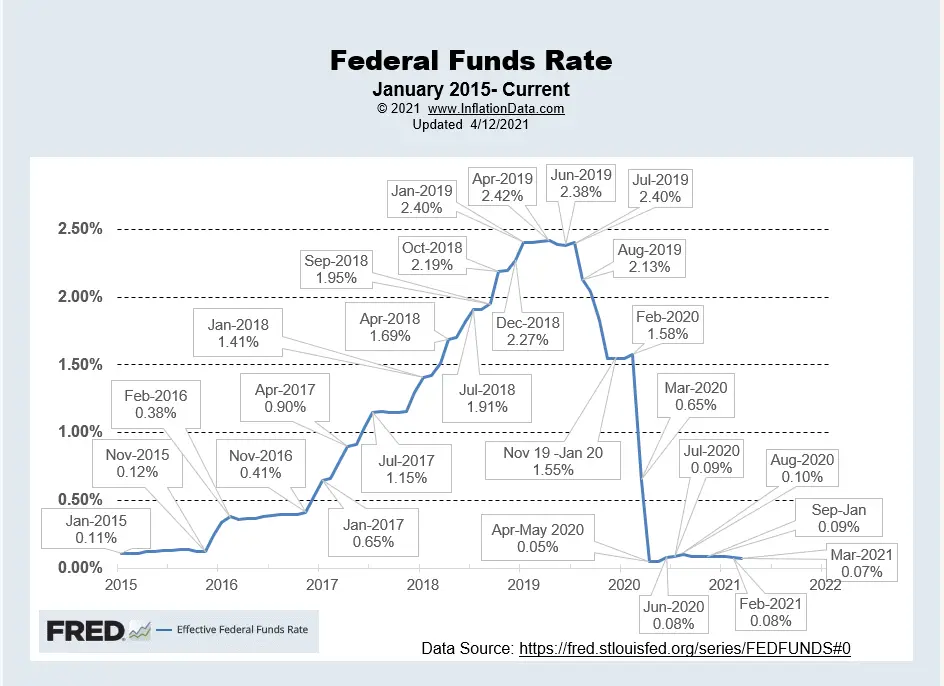
In the chart below, we can see that the FED Funds Rate peaked at 2.42% in April 2019 then the FED began fearing that it was holding too tight and the stock market was suffering so it began easing. It leveled off in November at 1.55% where it stayed until February. At that point, COVID tanked the market, and the FED loosened rates to virtually zero (actually 0.05%) five one-hundredths of a percent. In June they moved it up to eight one-hundredths of a percent and then in July, it inched up another one-hundredth of a percent. Then in August, it moved up another one-hundredth of a percent to 0.10% (i.e. one-tenth of 1%). Interestingly, even that was too high because they lowered it in September back to 0.09% where it remained through January 2021. In February the FED lowered the FED Funds Rate back to 0.08% and in March they lowered it again to 0.07%. Chart Source St Louis FED.
For more info See NYSE ROC and MIP.
Misery Index
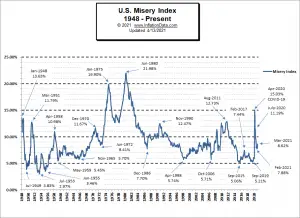 In September 2019, the Misery index bottomed near all-time lows at 5.21%.
By March 2020, it had climbed slightly to 5.94%. But in April, due to the COVID-19 shutdown and consequent high unemployment, the Misery Index shot up to 15.03% based on 14.7% unemployment and 0.33% inflation. By January 2021 it had retreated to 7.70% but due to the current spike in inflation it March it was back up to 8.62% based on 6.0% unemployment and 2.62% inflation.
[Read More…]
NYSE Rate of Change (ROC)©

Hold? Signal (Whipsaw)
This month’s NYSE ROC chart shows a massive spike due to comparing against the “V” shaped COVID drop of March/April 2020.
See the NYSE ROC for more info.
NASDAQ Rate of Change (ROC)©

Hold Signal!
The NASDAQ ROC also spiked up drastically.
See NASDAQ ROC for more.
Regional Inflation Information
The U.S. Bureau of Labor Statistics also produces regional data. So if you are interested in more localized inflation information you can find it here.
| AL | AK | AR | AZ | CA | CT | CO | DC | DE | FL | GA | GU | HI | IA |
| ID | IL | IN | KS | KY | LA | MA | MD | ME | MI | MN | MO | MS | MT |
| NC | ND | NE | NH | NJ | NM | NV | NY | OH | OK | OR | PA | PR | RI |
| SC | SC | SD | TX | UT | VA | VI | VT | WI | WA | WI | WV |
You Might Also Like:
From InflationData.com
- A Stock Pickers Guide To Thinking About Inflation
- How Inflation Can Effect Rising Prices
- We’ve Updated the Historical Oil Price Table
From UnemploymentData.com.
- March Unemployment Shows a Slight Improvement
- Fleet Management 101: What Does It Take to Do It Well?
- 6 Tips to Help You in a Successful Job Interview
- February Employment Shows Improvement in Leisure and Hospitality
- Start a Career in Financial Risk Management
From Financial Trend Forecaster
- Why These Stock Market Indicators Should Grab Your Full Attention
- Ripple the Cryptocurrency of Banks
- The Future of U.S. Energy Independence
- Top Financial Trends Shaping Banking
- The Death Of U.S. Shale Has Been Greatly Exaggerated
From Elliott Wave University
- You’re invited: Spot the Next BIG Move in Oil, Gas, Energy ETFs (April 7-14)
- Should Stock Markets Fear Inflation or Deflation?
- A Global “Debt Mountain”: Beware of This “New Peak”
- Bitcoin: Let’s Put 2 Heart-Pounding Price Drops into Perspective
- Spotting the Slide in Silver
From OptioMoney.com
- Downsizing to Pay Off a Mortgage – Is it a Good Idea?
- Teach Your Kids to Budget Money Effectively
- Top 7 Most Affordable U.S. Cities to Live In
- A Beginner’s Guide to Investing: 4 Major Dos & Don’ts
From Your Family Finances
- How to Master the Transition to Entrepreneurship
- Tips for Making Extra Income Through Real Estate
- How to Know What You Can Afford for Your Next Family Home
- Cheap Fun Things to Do With Kids This Spring
- 4 Benefits of Working with an Advisor for Your Personal Finances

Leave a Reply