
When we think about price changes we often think of them in terms of the changes in the Consumer Price Index (CPI-U for all Urban Consumers). Looking at it that way, we may get the idea that price movements are monolithic i.e. that they all move together, so “prices” were up 2% or 5% or whatever, over the last 12 months. But that is a bit misleading since prices all move independently. For this reason, the U.S. Bureau of Labor Statistics publishes a CPI database with a breakdown of all the various components. By analyzing the various components of the CPI over the last 20 years we developed the following Chart.
 Click Chart for larger image
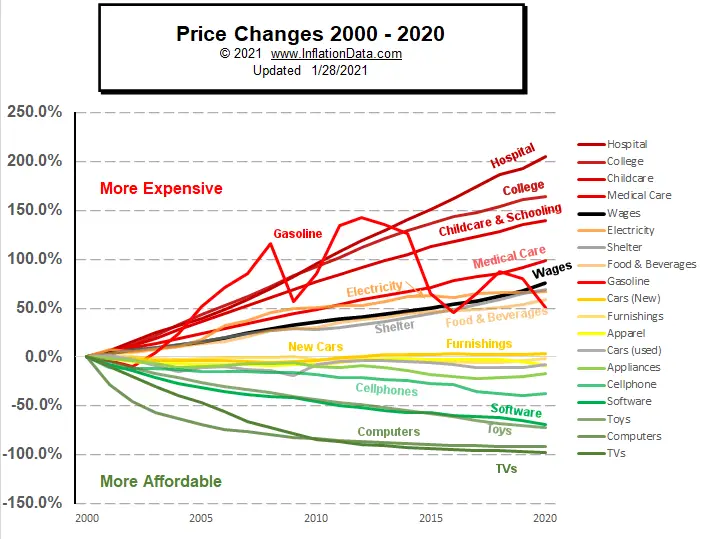
As we can see there is a massive difference between various categories. At the top of the chart increasing over 200% in the last 20 years is hospital costs. We must remember that an increase of 200% means that prices have TRIPLED (an increase of 100% would be a doubling of prices).
This is followed closely by college costs which increased by over 150% then “Childcare & Schooling” which increased slightly less than 150% and overall medical care which “only” increased by about 100%. If all prices increased by this much we would be in very sad shape.
Fortunately, at the other end of the spectrum, we have things like TVs, Computers, Toys, and Software which have drastically decreased in price. From the BLS data, it appears that they have decreased in price by almost 100%. But how can that be? They certainly aren’t giving away any computers in my town. Well, in addition to simply comparing prices the BLS also compares and adjusts for quality (which at first glance may appear like ‘fudging the numbers’).
If a personal computer cost $1500 in 2000 and now costs $500 you might assume that prices declined by 66% but today’s computer might be 10 times faster and have a hard drive that is 5 times bigger. So that faster bigger computer might have cost $10,000 or $15,000 in 2000 and that is what the BLS takes into consideration. The same holds true for many of the items on the bottom of the chart like TVs and Cellphones. In many cases, it would be virtually impossible to even buy items we now take for granted like cars that park and unpark themselves, with backup cameras, and side motion detectors, etc.
Interestingly, in the middle of the chart, we have things that are relatively unchanged in price such as Appliances, Apparel, and Furnishings. The one thing that this chart doesn’t tell us is the overall situation because all components are not weighted equally. The CPI-U weights various components based on the average consumption of the typical “Urban Consumer”. For instance, food is considered to be 14.082% of the average budget, Energy is 6.044%, and Shelter 33.320%. The food budget is further broken down to 7.753% food at home and 6.330% food away from home. Other items include almost 2% for Alcohol and Tobacco. But what if you don’t drink or smoke and bicycle to work? Obviously, this is just an average and so the CPI-U doesn’t apply exactly to anyone but is simply an average of everyone.
Wage Changes
Changes in prices are one thing but they only tell half of the picture. The other side of the coin includes changes in wages. If prices double but your wages triple you are actually better off than you were before. On the other hand, if prices increase 10% and your wages stay static, you are worse off. So we have to consider wage changes as well as price changes. In recent years, politicians and financial advisors have been telling us that “wages haven’t kept up with the cost of living” and “the average man is falling behind financially”. But that hasn’t been true since the last millennium. But apparently, when it is expedient there is no need to update your talking points even when they are no longer true.
Looking at the chart we can see how the BLS Wage Data compares to the price data. Wages have tracked very closely to Shelter, Electricity, and Food & Beverage costs. Of the items on the chart only Hospital, College, Childcare and Medical Costs have increased faster than wages.
The most volatile component on the chart is Gasoline which was up drastically in the first decade and down sharply in the second. So initially it was taking a greater portion of the average household’s income but by 2020 its increase was in line with wages.
What if You’re Retired?
Of course, not everyone’s income is tied to wages. Those on fixed incomes like retired people have probably fared the worst since they are not only seeing minimal increases in income but are also experiencing a higher proportion of their expenses going toward hospital and medical costs. The BLS has actually created another CPI index especially for the elderly called the CPI-e which the BLS still considers “experimental”. The BLS has considered it “experimental” since 1987 because there is no political willpower to adopt it. Since the CPI-e has a higher percentage of expenditures for things like healthcare, if it were adopted it would necessitate greater COLA raises for Social Security. For instance, the COLA for 2020 would have been 1.9% if the CPI-e were used rather than the 1.6% using the CPI-U. This may not seem like much but it would cost the government billions in extra payments to the elderly.
The other groups that are probably underperforming, are college students and those with several children in childcare. I suppose those performing the worst would be sickly college students with several kids.
Apparently, nerds with jobs who are buying Computers, TVs, Toys, and Cellphones are doing the best financially. While the average Joe buying Appliances, Clothing, Shelter, Cars, Furnishings, Food & Beverages, Electricity, and minimal Medical Care is holding his own or even getting ahead slightly.
Why has Hospital, College, and Childcare Increased Disproportionally?
It is interesting to look at the categories that have increased the most and ask “why have they increased more than other categories?” In each of these categories, we see government intervention supposedly for the “good of the consumer” but quite the opposite has happened. A good example is college education costs. When the government started guaranteeing student loans students stopped caring about the cost of education, so colleges had little incentive to keep costs down, and actually had great incentives to increase prices. The same happened in the healthcare and childcare industries. When someone else is footing the bill consumers don’t care about costs so costs naturally escalate.
You might also like:
- Sky Rocketing College Costs
- More Cost of Living Articles
- The Wealthy Buy Assets, the Poor Buy Liabilities, and the Middle-Class Buy Liabilities Believing They Are Assets

Leave a Reply