• Home
  • Related Sites
    • Financial Trend Forecaster
      • Moore Inflation Predictor
      • NYSE Rate of Change (ROC)
      • NASDAQ Rate of Change (ROC)
      • Crypto ROC- BTC & ETH
    • Unemployment Data
      • Historical Employment Data
      • Unemployment Rate Chart
      • Labor Force Participation Rate
    • Optio Money
    • Elliott Wave University
    • More Resources
  • Definitions
    • What is Inflation?
    • What is Core Inflation?
    • Inflation vs CPI
    • What is Deflation?
    • What is Disinflation?
    • What is Agflation?
    • What is Stagflation?
    • What is Hyperinflation?
    • What is Quantitative Easing?
    • What is Quantitative Tightening?
    • What is Velocity of Money?
    • What is Fiat Currency?
    • How Do I Calculate Inflation?
    • What are “Sticky Prices” and Why Do They Matter?
  • Featured Content
  • About Us
  • Feedback
    • Sitemap
  • Subscribe Now

InflationData.com

Your Place in Cyber Space for Inflation Data

CPIWidget-Jan26
  • Numerical Inflation Data
    • Current Inflation Rate
    • Monthly Inflation Rate (Moved)
    • Historical U.S. Inflation Rates
    • Historical CPI
  • Inflation Charts
    • Ann. Inf. Rate Chart
    • Long Term Inflation >
      • Ave. Inf. by Decade
      • Total Inf. by Decade
      • Inflation 1913-1919
      • Inflation 1920-1929
      • Inflation 1930-1939
      • Inflation 1940-1949
      • Inflation 1950-1959
      • Inflation 1960-1969
      • Inflation 1970-1979
    • Cumulative Inflation
    • FED Monetary Policy and Inflation
    • Inflation and Recession
    • Confederate Inflation (1861 – 1865)
    • Misery Index
    • The 3 Stages of Inflation
    • 15-Yr Inflation Trends Chart
  • Inflation Calculators
    • Cumulative Inf. Calc.
    • How Much Would it Cost
    • Salary Inf. Calc.
    • Cost of Living Calc.
    • U.K. Inf. Calc.
    • Cost of Gas Calc.
    • Net Worth Calc.
    • Lifetime Earnings Calc.
    • Savings Goal Calc.
    • Financial Calculators
  • Inf. Adjusted Prices
    • Energy >
      • Inflation Adj. Gas Prices
      • Historical Oil Prices Chart
      • Crude Oil Price (Table)
      • Natural Gas Prices
      • Electricity Prices
      • Oil vs Gold
    • Gold >
      • Inflation Adjusted Annual Average Gold Prices
      • Gold is a “Crisis Hedge” not an  “Inflation Hedge”
      • Comparing Oil vs. Gold
    • Corn Prices
    • Education Inflation
    • Housing Prices
    • Mortgage Rates
    • NYSE Index
    • Inf. Indexed Bonds
    • Movie Revenues
    • Inflation-Adjusted Wages
  • Cost of Living
    • Calculate Cost of Living
    • Cost-of-living Adj. (COLA)
    • Consumer Price Index CPI
      • Historical CPI
      • Current CPI
      • CPI Release Dates
    • Gas Prices >
      • Cost of Gas
      • Cost of Gas Per Month
      • Gas vs. Oil Price Chart
    • Food Prices 1913 vs 2013
    • Health Insurance
  • Blog
    • Key Inflation Articles
    • International Inflation
    • Historical Inflation Rates for Japan (1971 to 2014)
You are here: Home » Blog » Definitions » How the FED Controls the Money Supply

How the FED Controls the Money Supply

Published on February 27, 2020 by Tim McMahon Leave a Comment

When the government spends more money than it receives in taxes it has a “deficit” situation. In order to deal with this deficit, it engages in some fancy bookkeeping.

The government is made up of a variety of agencies, so the other agencies request money from the Treasury Department. If it doesn’t have enough money the Treasury Department issues an IOU (called a Government Bond).

The Treasury gives the Bond to the Federal Reserve (which is theoretically not part of the government). The FED writes a check to the Treasury for the bond. It then breaks up the bond into smaller bonds and sells them to individual banks.

The banks then sell them to individual investors and groups of investors (i.e. mutual funds, etc).

Another Way Money is Created

In addition to the Federal Reserve simply writing a check the commercial banking system can also create money through the “Fractional Reserve System”. Whenever people borrow money, banks are actually creating money out of nowhere. Although banks are required to maintain a small fraction of their assets with the Federal Reserve (i.e. reserve requirements).

Banks with less than $15.2 million in assets are not required to hold reserves. Banks with assets of less than $110.2 million but more than $15.2 million have a 3% reserve requirement, and those banks with over $110.2 million in assets have a 10% reserve requirement.

The idea is that not everyone is going to run to the bank and want to get all their money out all at once so, (unless there is a panic) so banks only need to keep a fraction on hand to cover those requests. The rest of the money can be loaned out to earn a profit. At first glance, you might wonder how this is creating money.

How Fractional Reserve Creates Money

When you deposit $10,000 in a big bank they can loan out 90% of it, so they turn around and loan out $9,000. So you might think that your money just went to the borrower just as if you had bought something from them.

But that is not the case. If you had bought something you would have a thing and no money but in this case, you still have your money (as an IOU from the bank) and the borrower also has the money as a loan from the bank.

But it doesn’t end there. The borrower then takes the $9,000 to a neighbor and buys a used car. The neighbor takes that money and puts it in the bank. The bank then loans out 90% of $9,000 or $8,100. And the cycle continues creating $7,290 and $6,561 and $5,904.90 and on and on.

There is actually a formula for calculating how much money will ultimately be created through a fractional reserve system, it is:

Initial Deposit x (1 / Reserve Requirement) = Total Money Created

So, for a 10% reserve requirement (0.10) the formula would look like this:

$10,000 x (1/0.10) = $100,000.00

So, each $10,000 can actually become, $100,000.

But what about the smaller banks with a 3% reserve requirement?

In that case the formula would be $10,000 x (1/0.03) = $333,333.33

If everyone deposited their money into smaller banks the initial $10,000 would actually become over $300 Thousand dollars.

How the FED Controls the Money Supply

As we saw, the FED can either print money by simply writing a check or it can adjust the Fractional Reserve Requirement. If they lower the requirement from 10% to 3%, they would effectively triple the multiplication factor. But they would also make the whole economy more likely to fail as more risky investments would be made.

Another problem is that the multiplication might not happen at all… due to risk aversion. After the crash of 2008 banks were reluctant to loan money and borrowers were reluctant to borrow, so no borrowing means no fractional reserve multiplication. Economists call this “Pushing on a String” it just doesn’t work.

So, the FED had to come up with another way to inject money into the economy. And so, they invented “Quantitative Easing”. In quantitative easing the FED bought up junk bonds and a variety of other debt instruments that the market was reluctant to accept and instead wrote a check for them. So, they converted illiquid bonds into ready cash. In the table below we can see how QE1, QE2 and QE3 affected the assets held by the FED.

Fed Assets Feb 2020

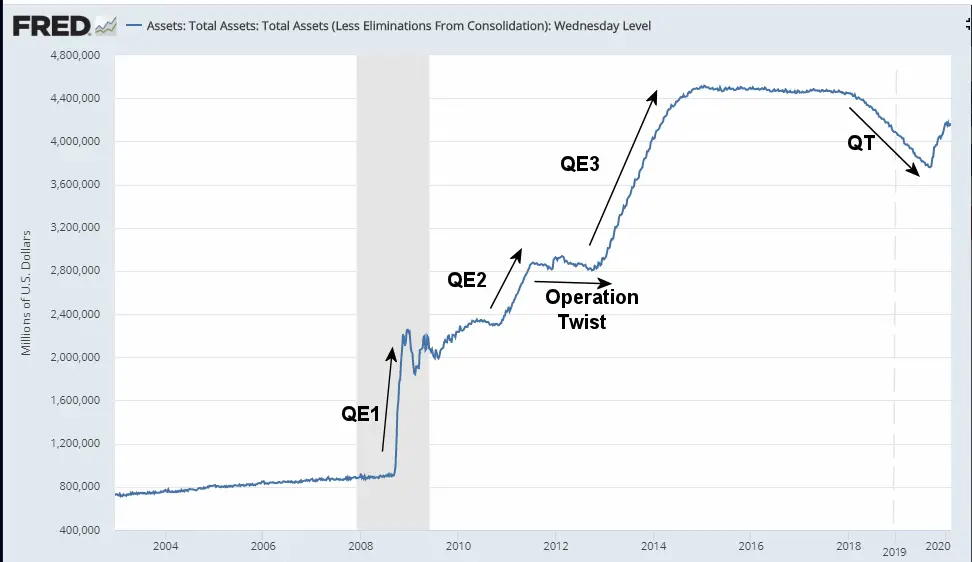
In the chart above, we can also see the FEDs attempts to reduce their holdings by allowing expiring assets to not be replaced in a move called Quantitative Tightening (QT).

You might also like:

  • What is the Real Definition of Inflation?
  • What is Core Inflation?
  • What is Hyperinflation?
  • What is “Leverage”?
  • What is the Difference Between Micro and Macro Economics?

About Tim McMahon

Connect with Tim on Google+.

  • Web
  • |
  • Twitter
  • |
  • Facebook
  • |
  • LinkedIn
  • |
  • More Posts(408)

Filed Under: Definitions, The Federal Reserve Tagged With: FED, Federal Reserve, Fractional Reserve, money, Money Creation, money supply, QE, Quantiative Easing

Leave a Reply Cancel reply

Your email address will not be published. Required fields are marked *

This site uses Akismet to reduce spam. Learn how your comment data is processed.

Latest Posts

  • Updated Cumulative Inflation Calculator
  • Inflation-Adjusted Silver Prices
  • December Inflation Down Slightly, Not Flat
  • December 2025 Inflation Report for November
  • How Deflation Created the Middle Class
  • October Inflation Numbers Delayed
  • Why the 2.8% COLA May Fall Short of Real Inflation
  • Delayed BLS September Inflation Data Released

Sponsored:

As a Seasoned Investor I thought I'd seen everything... But recently I discovered TradingView which has really improved the information I have at my fingertips.~ Tim McMahon, editor

TradingView gives me an edge... including powerful charting tools, real-time market data, and a global community of traders—all in one easy to use platform. It has hundreds of indicators, and even custom scripts for more advanced users, and you don't need to change Brokers just use its seamless brokerage integration... TradingView isn't just a charting tool—it's your full trading command center.

Trade smarter. Trade faster. Check Out TradingView for free.

----------

The Best Place to Buy Your Crypto

Coinbase is the largest Crypto Trading platform in the U.S. and the easiest to use. ~Tim McMahon, editor

Check out Coinbase here

Subscribe Now

eTrends Signup Form

Elliott Wave Resources

Free Elliott Wave Resources

What is Waveopedia?

Waveopedia is EWI’s free, comprehensive index of Elliott wave patterns and terms. Everyone from beginners to experts can benefit from it. It’s a great place to send your followers if they’re new to Elliott waves.

  • Deflation Hits China is the U.S. Next?

  • Why You Must Avoid the Herding Trap

  • Chasing Trends Can Cost You

  • More Education Resources

Post Archives

Home | Articles | Sitemap | Terms of Service | Privacy | Disclaimer | Advertise With Us

Copyright © 1996-2026 · Capital Professional Services, LLC · Maintained by Design Synergy Studio · Admin

Do Not Sell My Personal Information