
As inflation expectations rise the FED has less and less “wiggle room” to stimulate the economy. But how do you measure “inflation expectations”? In today’s article, Chris Ciovacco will show us. ~Tim McMahon, editor
Low Inflation Leaves Fed’s No Taper Door Open
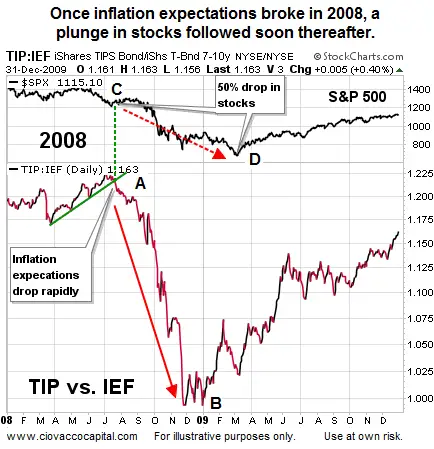
Fed Lost Control In 2008
 In early December, we used Japan as an extreme example of why central banks are terrified of allowing their respective economies to slip into a deflationary spiral. Do the same concepts apply to the United States? They do. The federal government offers standard Treasury bonds (IEF) and Treasuries that provide some protection against inflation (TIP). The law of supply and demand tells us that when demand for TIPS is greater than the demand for standard Treasuries, investors are concerned about future inflation. Conversely, when demand for TIPS is lagging demand for standard Treasuries, investors are not too concerned about inflation eroding the value of their interest payments. The chart below shows the S&P 500 (top) and the ratio of TIP-to-IEF below it. Demand for TIPS started to drop significantly in July 2008 (left of point A). As inflation fears plummeted, it helped foreshadow the big drop in equities between points C and D. The chart below helps us understand the Fed’s concerns about possible deflation.
2013: Inflation Expectations Remain Subdued
How weak are inflation expectations in 2013? Even with the Fed conducting three separate money-printing campaigns (QE), investors are not migrating to TIPS for inflation protection, which speaks to their relatively weak expectations about future inflation.
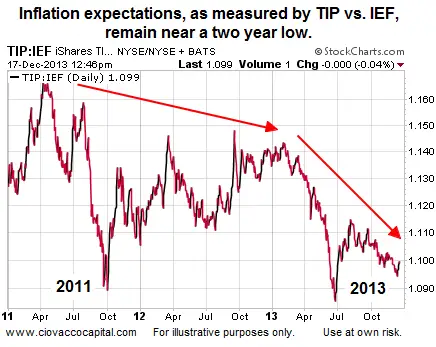 The Fed’s bond buying has failed to help them meet their inflation target of 2%, (as of November data inflation is at 1.24%) which aligns with the feedback from the TIP/IEF ratio.
Diminishing Returns For QE?
The Fed’s desire to taper is driven more by fears of another round of bubbles, rather than some direct tie to their dual mandate or an impressive run by the global economy. Some Fed governors believe the benefits of printing more money is questionable. But other governors remain in the QE camp. From The New York Times:
But there is no consensus inside the Fed that the benefits of the bond buying, often referred to as “quantitative easing,” are wearing off. “I don’t buy this diminishing returns thing,” James Bullard, president of the Federal Reserve Bank of St. Louis, said in an interview with Bloomberg Television last month. “If you lowered the funds rate from 5 percent to 4 percent, and then you lowered it from 4 percent to 3 percent, you probably wouldn’t say that the second hundred basis points was less effective than the first 100 basis points. And I don’t think we should say that about the Q.E. program either.”
Some Puzzled By Low Inflation
 It seems reasonable to believe that periods of low inflation naturally follow periods of easy credit and over-consumption (see 2003-2007). Over-consumption leads to excess capacity once the bubble pops. Excess capacity speaks to low pricing power. The concerns about the threat of the global economy slipping back into deflation are well documented. From The New York Times:
Officials are also not particularly afraid of inflation. While some Fed officials worry about the risk that buying bonds will lead to faster inflation, the Fed, if anything, is increasingly confronting the opposite problem. Several Fed officials in recent weeks have expressed puzzlement over why prices have been rising at an unusually sluggish pace.
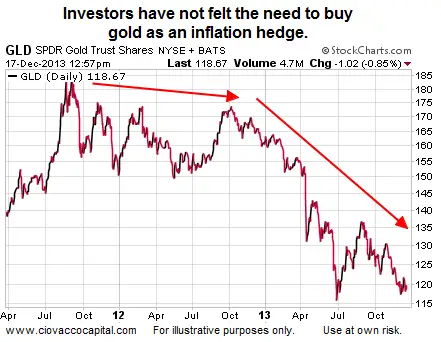
Mellow For Yellow Metal
Typically, demand for gold rises when investors become concerned about currency debasement, which aligns with inflation and reduced purchasing power. The story on the gold front also aligns with a low inflation expectations environment. From Bloomberg:
Gold futures fell for the first time in three sessions after a report showed no change in the U.S. cost of living in November from a month earlier, reducing demand for the metal as a hedge against inflation. “Metals markets need to see some inflation before they can rally because they’ve lost their appeal as an inflation hedge,” Chris Gaffney, the senior market strategist at EverBank Wealth Management in St. Louis, said in a telephone interview. “That’s taken a lot of buyers out of the market.”
Taper – A Very Close Call
Current inflation expectations or lack thereof, tell us:
- The odds of a “no taper” announcement Wednesday are higher than many believe.
- If Wednesday brings a taper, the size of the taper will be relatively small and accompanied by “we may print more, or we may print less going forward based on the economic data”.
From The Wall Street Journal:
Donald Kohn, former Fed vice chairman, said Friday he would hold off until next year before reducing the bond buys. However, he sees better-than-even odds the central bank will move Wednesday. “I think I would wait. But it’s a very close call,” he said.
Investment Implications – Wait And See
Even if we had Wednesday’s Fed statement in hand, it would not be as helpful as you might think. Why? We still would not know the market’s reaction to the statement. Since the market sets asset prices, the reaction is much more important than the statement itself. Therefore, our game plan is to see how things unfold over the next few days and adjust accordingly. For now, we will continue to hold a good size risk buffer in the form of cash, to compliment our exposure to U.S. stocks (VTI), technology (QQQ), financials (XLF), energy (XLE), small caps (IWM), emerging markets (EEM), and foreign stocks (EFA).
You May Also Like:
- FED Looks for New Ways to Crank Up Money Supply
- Rising Inflation vs. FED Tapering
- The Language of Inflation
- Deflationary Forces Overpower FED
- Pushing on a String, Velocity of Money and Money Multiplier Conspire Against the FED
 |
 |
 |
 |
| The Federal Reserve: What Everyone Needs to Know |
The Creature from Jekyll Island |
Federal Reserve | End the Fed |
About the Author:
Chris Ciovacco is the Chief Investment Officer for Ciovacco Capital Management, LLC. This article is © Ciovacco Capital Management, LLC. All Rights Reserved and originally appeared here and is reprinted by permission.

Leave a Reply