
Despite Bernanke’s famous helicopter speech the FED’s powers really are not unlimited. There is only so much they can do to stimulate the economy. After all they can’t force people who are concerned about their future to borrow money. Just like a turtle people naturally recoil and pull back when times are uncertain. And even if they wanted to borrow bankers are reluctant to lend in uncertain times. This results in a phenomenon called Pushing on a String where no matter how hard the FED tries very little force is exerted on the economy. Robert Prechter believes that this is exactly what has been happening over the last few years where the FED has been trying to stimulate the economy but the only effect has been an anemic rebound in the stock market. ~Tim McMahon, editor
Deflationary Forces Stymie the Fed’s Economic Rescue Efforts
See a stunning chart of the Federal Reserve’s assets
By Elliott Wave International
The Federal Reserve’s efforts to rescue the economy have been historically aggressive, starting with the initial round of quantitative easing in 2008 and continuing through 2013.
The central bank’s assets have skyrocketed due to the Fed’s bond purchases, which you can see clearly in this eye-opening report that Robert Prechter presented to the Market Technicians Association and his Elliott Wave Theorist subscribers.
Download the full 8-page report for free here.
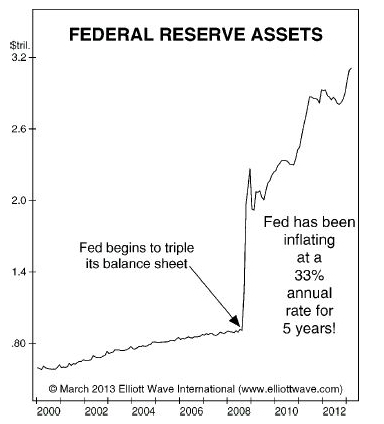
The main reason investors are expecting runaway inflation is illustrated in [the chart above], which shows the value of assets held at the Federal Reserve. The Fed has been inflating the supply of dollars at a stunning 33% annual rate over the past five years. … [N]o wonder investors expect inflation and have aggressively positioned for it.
Look just about anywhere else, however, and you will see subtle evidence of deflationary pressures. Given knowledge only of the Fed’s inflating, many people would expect the Producer and Consumer Price Indexes to be rising at a rate of 33% annually. But, as you can see in Figure 2, the PPI’s annual rate of change is stuck at zero and the CPI has been rising at only a 2% rate.

The Elliott Wave Theorist, July-August, 2013
In an interview at the recent San Francisco Money Show with financial author Jim Mosquera, EWI’s Chief Market Analyst Steven Hochberg explains why the Fed has gotten so little in return from its stimulus programs. Here’s a brief excerpt from the interview published on Aug. 18 on the Examiner.com website.
Question: The Fed wizards have been pushing buttons and pulling levers rather furiously since 2008. The discount rate is rock bottom, and the Fed balance sheet has swelled to the tune of trillions. What button is left for them to push?
Steve Hochberg: That is a really interesting question the way you phrased it because the fact that they have been pushing buttons and have gotten very little in return tells us … that the Fed is not in control. The Fed does not control the markets, and it doesn’t control the economy. Both are bigger than the Fed.
You say they have been doing this furiously. They have been doing this historically! Yet if you look at inflationary measures, such as the Personal Consumption Expenditures, which is the Fed’s favorite way of measuring inflation, it’s bumping along at 1%.
We have had historic fiscal and monetary stimulus and yet no inflation. Why? The forces of deflation are overwhelming the forces of inflation. The Fed dropped interest rates in 2000 to 2002 and that did not stop the Nasdaq from dropping 78%. The Fed dropped rates from 2007 to 2009 and it did not stop the Dow from going down 59%. There is historical evidence that the Fed does not control the markets but that the markets control the Fed.
As the next leg of the bear market starts unfolding, they are going to do more unconventional things. Things will accelerate to the downside when the public realizes the central banks aren’t in control.
Editor’s Note: In Elliott Wave International 8-page, free report they show how this relates to the CRB commodities index, Oil, Gasoline, Wheat, Soybeans, Corn, Gold, Silver, Copper and Real Estate. See it all in: How to Protect Your Money When the U.S. Debt Bill Comes Due.
 |
How to Protect Your Money When the U.S. Debt Bill Comes DueRead this new FREE report from Robert Prechter The Federal Reserve has been inflating the supply of dollars at a stunning 33% annual rate over the past five years. You don’t want to be unprepared when that bill comes due! Read this free report from Robert Prechter, market forecaster and a leading opponent of the Federal Reserve, and learn how you can protect yourself. As a result, you will understand today’s biggest risks to stocks, commodities, precious metals and the economy — risks that most mainstream sources cannot see because they’re blinded by decades of inflationary Fed policy. Download your FREE report by Robert Prechter now – for a limited time >> |
See Also:
- Pushing on a String, Velocity of Money and Money Multiplier Conspire Against the FED
- What’s So Bad about Shutting the Government Down?
- Taper Caper: The Consequences of Institutionalizing Q.E.
- A Monetary Master Explains Inflation


This article was syndicated by Elliott Wave International and was originally published under the headline Deflationary Forces Stymie the Fed’s Economic Rescue Efforts.
EWI is the world’s largest market forecasting firm. Its staff of full-time analysts led by Chartered Market Technician Robert Prechter provides 24-hour-a-day market analysis to institutional and private investors around the world.

Leave a Reply