Is Quantitative Easing Money Printing?
Quantitative Easing is often referred to as “money printing” or a way for the government to increase the money supply. According to Wikipedia, quantitative easing is different from the typical method whereby governments buy treasury debt to increase the money supply. In QE1 when the market was panicked, and banks didn’t want to buy government bonds, the central bank implemented “quantitative easing” by purchasing relatively worthless financial assets (like mortgage backed securities) from banks and giving them new electronically created money. So this is straight forward money printing compared to the more round about traditional method.
Thus Quantitative Easing increases the excess reserves of the banks creating liquidity for the markets.
Effects of Quantitative Easing
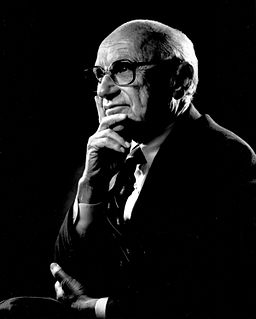
Milton Friedman
Legendary economist, Milton Friedman once said: “Inflation is always and everywhere a monetary phenomenon.” In other words, inflation is always caused by printing too much money. But the results are seen in prices of commodities like food, clothing and energy after the printed money works its way through the economy.
Generally, after a round of “Quantitative Easing” (aka. Money Printing) it usually takes one to two years for it to show up in popular pricing. The time lag gets smaller as people catch on to the cause and begin to anticipate more inflation. The time lag is also why many people fail to see the correlation between money printing and inflation.
Since the majority of our money these days is not physical paper but simply numbers on a balance sheet, instead of physically cranking up the printing presses these days, the way the FED increases the money supply is by buying debt on the open market and replacing it with bank deposits. In other words, it takes liabilities and magically turns them into assets. Theoretically someone owed the banks this money but the banks may have had to wait 30 years to get it (if they got paid at all). But the FED bought it and so the banks are now liquid (but the FED is holding all the worthless debt).
The first Round of Quantitative Easing (QE1)
In the case of QE1, the US Federal Reserve held $700–$800 billion of Treasury notes (government debt) before the recession began. In November 2008, the Fed began buying $600 billion Mortgage-backed securities (MBS). This is private debt backed by sometimes worthless mortgages. By March 2009, it held $1.75 trillion of bank debt, MBS, and Treasury notes, with it reaching $2.1 trillion in June 2010.
So based on the 1 to 2 year time frame you would expect inflation from QE1 to begin between March 2010 and March 2011 and if no more easing occurred, we’d expect the inflationary pressure to end somewhere between June 2011 and June 2012.
QE1 Inflation Begins
As predicted, inflation began well within that target range. Inflation began in earnest in January of 2011 with a monthly rate of 0.48% (roughly 21 months after QE1 began). It probably started a bit slowly because of the massive deflation that was affecting the world-wide economy. And by mid-2011 the effects of QE1 began to peter out with October, November and December having monthly deflation.
Theoretically, since the QE1 money creation spree lasted 19 months it is quite possible that the inflationary effects will last approximately 19 months. However, the evidence from the end of 2011 seems to be that its effects are primarily spent. But QE1 was not a steady increase it had its ups and downs so we can expect the inflation rate to fluctuate as well. Although it appears that inflation from QE1 has subsided, as we saw in January 2012, we may still see some effects between now and July of 2012 with some up and down fluctuations. On the other hand January through March could be simply an Oil shock based on the “saber-rattling” between Iran and the U.S.
The Second Round of Quantitative Easing (QE2)
QE2 began in November of 2010 and ended in June of 2011. So we have an additional 8 months or so of monetary increases from that. So if it follows the pattern of QE1 we can expect the effects of QE2 to begin roughly 21 months from November 2010 or around July 2012. But because we aren’t in the throes of a massive deflationary panic (unlike when QE1 started) it may have begun earlier, pick up quicker and have a greater impact.
So far January and February 2012 each had 0.44% inflation for the month March had a whopping 0.76% and April had 0.30%. This may be the beginning of the effects of QE2 and it could continue through as late as August 2013. By that time we could see inflation as high as 10-12% if the Euro crisis doesn’t create massive deflationary forces to counteract it.
Theoretically, the rise in the price of Oil in March could be the beginning of the results of QE2 and Oil is just more sensitive to it. However, in an effort to hold the price of oil down the government has threatened to release strategic oil reserves which masks the inflationary effects of quantitative easing.
The other area we may be seeing the results of QE2 is in the stock market as the liquidity flows there. Interestingly, the stock market is one place where people like to see inflation, the other place is in the housing market (even though it tends to price new buyers out of the market).
However, Inflation rates above 5% begin to cripple the economy as we saw with the last Oil spike (July 2008). So as the higher monthly numbers continue to drop out of the equation over the next couple of months we should see the inflation rate continue to fall giving people a false sense of security as they don’t realize the effects of QE2 are still around the corner.
Current Quantitative Easing Moderating Factors
The only reason Inflation isn’t 100 times worse than it is currently is because the Fed is paying banks to hold on to all that money it printed. Basically the FED created money out of thin air and loaned it to the banks at almost zero percent interest. The banks turned around and loaned it back to the government at about 3% interest to finance the public debt. This results in a hidden form of bank bailout as the banks make 3% profit on free money and the government can pretend that it isn’t bankrupt.
China on the other hand is accumulating Gold like crazy in a possible bid to eventually become the World’s reserve currency and avoid the effects of the dollar. This could be the biggest trend of the coming decade and you need to know about it.
See Also:
- Why (and How) China is Boosting the Price of Gold
- Iran Says “Gold Is Money”
- The Long Road to Inflation Perdition
To see some independent (non-government) inflation numbers see our article: Can We Trust the Government CPI Numbers?

Leave a Reply