

The government shutdown is over and the U.S. Bureau of Labor Statistics is recovering from their unscheduled vacation. The United States federal government shutdown of 2013, lasted from October 1 to 17, 2013. Unemployment data for the month of September was due to be released on October 4th i.e. four working days into the shutdown. So the employment data is now scheduled for release on October 22nd. And the Consumer Price Index which is used to calculate the September inflation rate, which was scheduled for release on October 16th is now scheduled for release on October 30th. Although the shutdown inconvenienced vacationers wanting to see National Monuments and the National Zoo, did it … [Read more...]
A Reader Question About IRAs and Gold Stocks
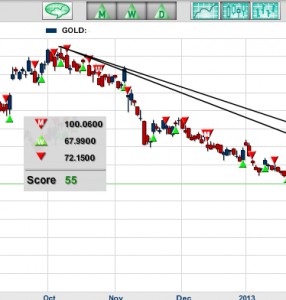
I recently got an excellent question from a longtime reader named Bob and I thought I would pass along some of what I told him. Bob has invested a good portion of his IRA in shares of Randgold Resources. The NASDAQ symbol is GOLD. Randgold Resources is a gold mining business based primarily in Mali. Its headquarters are in Jersey, the Channel Islands, it is listed on the London and the NASDAQ stock exchanges. Bob has been accumulating shares of Randgold because he feels that as a mining company it is a productive asset rather than physical gold (or paper derivatives of gold) which earns no interest (or dividends). Randgold peaked at around $127 back in October 2012 and has been trending … [Read more...]
Syria in the Throes of Hyperinflation

Living in the United States or other "stable" countries, we tend to think that Hyperinflation is a relatively uncommon event but that is far from the truth. In our post What is Hyperinflation? We list 26 instances of hyperinflation 11 of which have occurred since 1990. It seems that every couple of years there is another one. Even in the midst of deflationary pressures we have seen Zimbabwe (which ended in 2008), North Korea (2010-13) and now Syria. In Surviving a Hyperinflation we noted that "Hyperinflation only occurs in countries where the government has already broken down. Weimar Germany was mired in a social Civil War… Zimbabwe never had a working democratic government and the … [Read more...]
The Case of the Disappearing Gold

When I was in the 6th grade (many, many years ago) my class took a field trip to New York City and visited the NY FED. The highlight of the trip for me was a ride down the elevator (or more precisely what was at the bottom. The ride took forever with dozens of kids and one security guard in that tight stuffy space. Anticipation built as we went down what seemed like miles into the earth where the vaults rested on Manhattan bedrock. And what was in those vaults? Gold! Lots of gold! Each vault had a name on it but not people's names, countries names. After all in those days people weren't allowed to own gold. For years now there has been a controversy as to whether our (the U.S.) Gold … [Read more...]
Marginal Utility
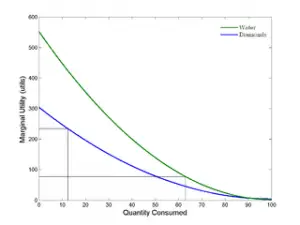
In economics, the marginal utility of a good or service is "the perceived value from an increase in the consumption of that good or service". In other words, how much benefit do you get from using or consuming one more. The concept of marginal utility grew out of attempts by economists to explain how individuals determine price. The term “marginal utility” is credited to the Austrian economist Friedrich von Wieser which was a translation of Wieser's term “Grenznutzen” (border-use). For years economists knew that there was some sort of interrelationship between utility and rarity that affects economic decisions, but were at odds to quantify it. In opposition to what Karl Marx might have … [Read more...]
Highest Grossing Movies Adjusted for Inflation

Traditionally, war films, musicals and historical dramas have been the most popular genres and Gone With the Wind held the record of highest-grossing film for 25 years but doesn't even make it into the top fifty in the modern market. But purchasing power varies widely over the time period since Gone With the Wind was first released in 1939. But the true key to determining how revenues really compare is when you adjust them for inflation. Highest-grossing films (Nominal) First we will look at nominal gross box office revenues. That is the actual number of dollars (not adjusted for inflation) earned strictly in the box office. Modern films have an advantage because in addition to box office … [Read more...]
Buying or Selling Gold and Silver?
Many investors consider the recent drop in gold, silver and platinum prices to be the perfect opportunity to build (or add to) their precious metals position. With the price down, the basic law of supply and demand has kicked in and demand for silver bullion and silver coins has risen sharply. Short-term, supply has gotten tight, as some dealers scramble to keep up with demand. We also saw a major disconnect between Physical Gold vs. Paper Gold as a massive sell order hit the futures market to sell 400 tons of gold! But at the same time small buyers rushed to their local dealer to take advantage of the price drop and stock up on the physical metal. And of course since gold and silver … [Read more...]
Long Term U.S. Inflation
We have updated the charts on long Term Inflation, including Average Annual Inflation by decade, Cumulative Inflation by Decade and Cumulative Inflation since 1913. The Chart below shows the Annual Inflation Rates for each decade. Each bar represents the average Annual Inflation for that decade (not the total cumulative inflation for that 10 year period but how much it increased each year on average during that decade). Do you know: 1) Average Annual Inflation since 1913: 2) That deflation in the "Roaring 20's" was almost as bad as in the "Great Depression" of the 1930's? 3) How Crop Subsidies affected farm prices in the 1920's and 30's? 4) How the proliferation of … [Read more...]
Inflation Trends since 1914- The 15 year Cycle
Inflation like everything else it seems has cycles. It trends up for years and then for almost no reason begins falling again. After a while it rises again. Unfortunately, while it is doing its long term dance it is bouncing up and down creating so much "noise" that it is difficult to see the longer term trend. The chart below shows this trend by adding a 5 year moving average to the inflation rate. This smooths out the noise so we can see the underlying trend. And surprisingly it is actually quite regular. Inflation Cycles Approx. Every 15 Years From the chart we can see that beginning in 1917 we had 15 years of declining inflation until the bottom in 1932. From there inflation … [Read more...]
Regarding Gas Inflation

Doug S. Says I'm full of It- Regarding Gas Inflation I just got the following comment from Doug S. I saw the chart on how gas prices haven't really risen when considered with inflation. I am 61 years old, and when I was working in the mid- to late-60s as a high school student, I made $1.60 an hour as minimum wage. Gas was only .25-.35 per gallon (with 'gas wars', much of the time cheaper) so with one hour of work I could purchase 5-6 gallons of gas. Now, with a minimum wage of $7.50 or so, you can only purchase a bit more than 2 gallons of gas, depending on the day of the week. Minimum wage has gone up, what, 4.6-5 times or so, but gas prices have gone up 10 times or more. Where am I … [Read more...]
