
I recently got an excellent question from a longtime reader named Bob and I thought I would pass along some of what I told him. Bob has invested a good portion of his IRA in shares of Randgold Resources. The NASDAQ symbol is GOLD. Randgold Resources is a gold mining business based primarily in Mali. Its headquarters are in Jersey, the Channel Islands, it is listed on the London and the NASDAQ stock exchanges. Bob has been accumulating shares of Randgold because he feels that as a mining company it is a productive asset rather than physical gold (or paper derivatives of gold) which earns no interest (or dividends).
 Randgold peaked at around $127 back in October 2012 and has been trending down ever since. During that time Bob has been averaging his costs down with a current average price of $92.00. When Bob wrote, Randgold was near its recent lows of $66. and he was wondering if I thought he should cut his losses or hold on. Here’s my response:
Bob,
I am not a licensed investment advisor (although I was at one time) so I can’t give personal advice. Even if I could, you have not told me enough about your personal circumstances to make a good judgment i.e. what portion of your total savings is this, time frame to retirement, etc. But I can give you some general guidelines.
1) Historically, no asset class has ever been a stellar performer 2 decades in a row. Gold did very well over the last 10 years. So it is going to take more skill to make a profit in gold this decade, rather than just buy and hold. But gold stocks could be considered a separate asset class.
2) Gold does well when interest rates are low or falling and fear is high or rising.
3) Over long periods of time gold keeps up with inflation, short term it is like any other investment you have to buy it low and sell it high. (At the moment it is in the middle)
4) Many years ago I made the mistake of averaging down as prices fell and decided never to do it again. This is the opposite of using stop losses which I think is a better policy.
5) I believe perhaps 5% of your total portfolio should be held in physical gold no matter what the price. This is for insurance purposes against a total catastrophe. Unfortunately, that is difficult in an IRA (although not impossible with the right custodian).
6) Another 5% can be held in “paper gold” if the market warrants.
7) Diversification across asset classes guarantees some of your holdings will be losers but it is still a good policy because some will be big winners as well.
8) You should cut your losses early. If you wait too long, at some point it may be better to wait it out and watch for a rebound to rebalance your portfolio. But a bad bet can still go to zero and never rebound.
9) Putting too much in any single investment (or asset class) makes it hard to sleep at night.
10) Legendary Investor Jesse Livermore said– Never bet that things that aren’t happening will start happening. Bet instead that things that are already happening will keep happening.
I don’t have a crystal ball but my guess is that gold will rebound from here in the Fall once the Summer doldrums are over. Will it get above $1900/ounce this time around? Who knows? Have we seen the worst of the gold rout? I give it a 60- 70% chance that we have seen the bottom for the short term. But there is a 20% chance that it could go as low as $900 before rebounding. That leaves a 10-20% chance that gold will bounce around between $1000 and $1300 for a while. Perhaps a long while, as Gold builds another base. Gold may currently be the crisis Du Jour care of the big traders “Pump and Dump” where they are constantly pumping up one asset class while dumping another. They make money on the way up and on the way down, while the little guy suffers. I think that is why there is a disconnect between paper gold prices and physical gold (because the manipulation only works for paper assets and there is still demand for physical gold at current prices). When they are finished driving the prices down we will see a rebound. But, if interest rates are rising it will make it harder for gold to rise because there is an opportunity cost for holding it. At high interest rates paper assets pay dividends. At low rates why not hold something that is no one else’s liability and has real value?
Hope this Helps,
Timothy McMahon, Editor
So if we take Jesse Livermore’s advice we would not bet that Randgold was going to turn around but wait for an indication that it has turned. Now let’s look at the chart for Randgold and see what it is telling us. I’m using Ino’s MarketClub chart.
click for larger image
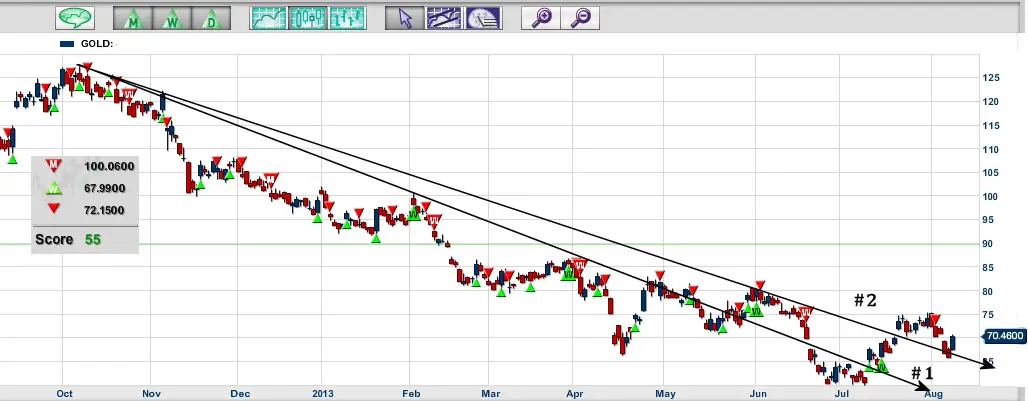
I’ve drawn two trend lines we can see that it tested trend line #1 in February again in April and finally tried very hard in early May bouncing along the line and finally breaking through in late May. Other positive signs were low in mid-April was followed by a higher low in mid-May.
But the victory was short-lived and in late June trend line #1 should have acted as support but it was no support at all and the trend continued it’s downward direction. But in early July it broke back through generating a small green triangle signaling a “Daily” buy signal on MarketClub’s proprietary system. A couple of days later it generated a slightly bigger “Weekly” green triangle buy signal. At this point, because we had a higher peak in June, we can draw trend line #2 which should be our next resistance. But Randgold breezed right through it without any resistance at all and now it looks like it might be acting as support but it is too early to tell for sure. But it did generate a “Daily” red triangle so at this point the Monthly Trend is down, the Weekly trend is up and the Daily trend is down. But the overall Market Club score is a positive 55. A negative 100 is very bearish and a positive 100 is very bullish so it is possible that Randgold is turning around. So far support line #2 has held but it is still early.
So what signals are we looking for that would indicate that Randgold’s downtrend was over? First, it needs to stay above trend line #2. But it also needs to get and stay above the July 31st peak of $75.41. That will give us a higher low and it will also generate a “daily” green triangle in the process. The final indicator would be a move above the June high of $80.50 and the generation of a “Monthly” green triangle buy signal. At that point, Randgold would be a “Buy” even if the daily triangle turned red. Caution would be indicated if the weekly turned red and a sell would be indicated if the monthly turned red again. As you can see from the chart the last time the monthly turned red was in December of 2012 at $100.06. Had Bob gotten out then he could have avoided the painful ride back down to $60. Of course, we won’t have a safe monthly buy signal until around $80 so more aggressive traders might buy on the generation of the Daily and the weekly but with tight stops to prevent a major loss if the direction turns around again.
If you would like to learn more about how to use Market Club and hear the current Market Club commentary by Club President Adam Hewison, you can watch the video below (it will open in a new window).


What is the best precious metal to invest in gold, silver or platinum?
Richard,
A lot depends on your personal situation and the purpose. Silver might have a bit more leverage but it also has other factors that drive it’s price because of its industrial uses. Gold is primarily used as a monetary substitute and for jewelry. Silver is Industrial, jewelry and then monetary and Platinum is primarily industrial, with a little jewelry and even less investing. So a lot depends on what part of the business cycle we are in which will do best. Hope this helps.