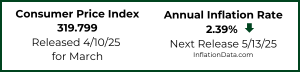
The U.S. Bureau of Labor Statistics (BLS) released the Consumer Price Index (CPI-U) data today for the month of January. The verdict was that inflation had fallen rapidly from 0.76% in December to a slightly deflationary -0.09% for the 12 months ending in January. This is the first time since 2009 that we have seen Annual deflation although there were several times during 2014 that we saw monthly deflation. Monthly deflation (annual disinflation) means that prices are slightly lower than they were last month but still higher than a year ago, which typically happens a few times every year (generally in the 4th quarter), but this year prices began falling during the summer, indicating … [Read more...]
Updated Inflation Adjusted Gasoline Price Chart
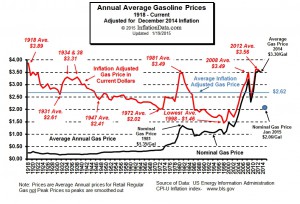
With the recent drop in gasoline prices perhaps you have begun to wonder exactly how close to historical lows are we? If so we have updated our famous Inflation Adjusted Gasoline Price Chart. It shows where we stand on an inflation adjusted basis. Lowest Inflation Adjusted Price of Gasoline was $1.46 in 1998 Back in 1918 gasoline was $0.25 a gallon and by 1932 prices had fallen to 18 cents a gallon! But as we all know over the last 100 years the purchasing power of the dollar has fallen drastically so in order to get the true picture we can’t just say that the lowest price of gas was 18 cents per gallon, we need to adjust the price for inflation. When adjusting for inflation there are … [Read more...]
Annual Inflation Below 1%
The U.S. Bureau of Labor Statistics released their monthly Consumer Price Index (CPI) data on Friday January 16th for December and for the first time since 2009 reported annual inflation below 1% (although we calculated October 2013 at 0.96%). The Consumer Price Index (CPI) for December was 234.812 down from November’s 236.151 which was also down from 237.433 for October. This resulted in a monthly decrease in prices of -0.57% and an annual inflation rate of 0.76%. Overall energy on a “seasonally adjusted” basis was down -4.7% for the month and -10.6% on an unadjusted basis for the entire year. Fuel oil fell -7.8% for the month (adjusted) and a whopping -19.1% annually. Gasoline was … [Read more...]
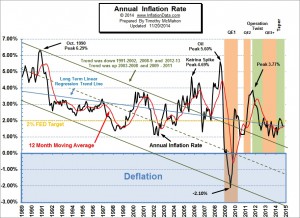
Bureau of Labor Statistics: Inflation Down
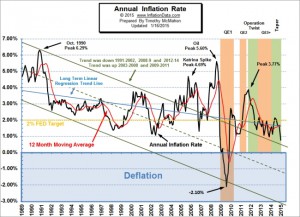
The U.S. Bureau of Labor Statistics released their monthly Consumer Price Index (CPI) data on Wednesday December 17th for November and reported lower inflation. The CPI for November was 236.151 down from 237.433 for October. This resulted in a monthly decrease in prices of -0.54% and an annual inflation rate of 1.32% down from 1.66% in October. View the chart and read the full commentary on the current annual inflation rate. Although the FED has been targeting a 2% annual inflation rate, rates are currently much lower and have often been considerably higher than 2% as well. The FED has hit their 2% target a total of 6 times out of more than 300 data points. If we count all the … [Read more...]
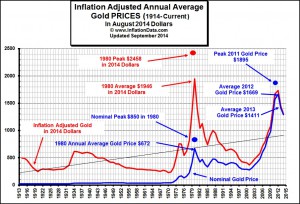
Crude Oil and Gold
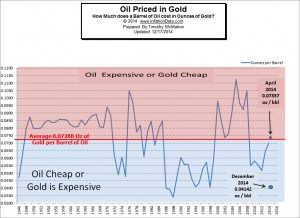
Because inflation decreases the value of of money, in order to have a “yard stick” of constant value it is necessary to use the inflation adjusted price when we consider the price of a commodity like Oil. Here at InflationData we have provided a variety of charts of the inflation adjusted price of commodities like Oil, Gasoline, Electricity, Natural Gas, Stock Market, Housing Prices, Education Costs and much more. But each of these requires you to rely on potentially flawed inflation statistics generated by some outside agency or government. If that agency has an agenda other than accuracy your cost estimates could be flawed. But there is an alternative and that is to compare your … [Read more...]
Inflation Flat for October
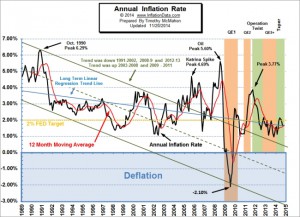
The Bureau of Labor Statistics released the Inflation rate for the month of October today. Annual inflation remained steady at 1.66% even though prices fell from the month previous (i.e. monthly inflation was -0.25%). However, since monthly inflation was -0.26% in October 2013 annual inflation rates remained virtually identical as October 2013 was replaced by October 2014 in the calculations. The FED has stated that it's goal is to maintain inflation at a steady 2%. But as we can see from the chart they have rarely achieved that goal. If the goal was to remain below 2% we could say they have done very well since 2012 however during that time-period the FED has been fearing deflation … [Read more...]
Inflation Down Again
The Bureau of Labor Statistics (BLS) released the September inflation numbers on October 22nd and inflation is lower for the fourth month in a row. Annual inflation in May was 2.13% in June it was down to 2.07% (although the BLS rounded both to 2.1%). In July inflation fell to 1.99% and in August it was down to 1.70% and in September it was 1.66%. Once again the BLS rounded both August and September to 1.7%. The last few months are a perfect reason why it is important to use our two decimal place inflation calculations. So although we have seen a steady decline, using the BLS numbers you would see 2.1%, 2.1%, 2.0%, 1.7%, 1.7% and so the decline is not so obvious. As the inflation rate … [Read more...]
Where is Gold Headed?
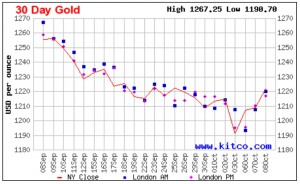
This week has been tumultuous for the markets with steep market drops and subsequent rallies. Over the last month gold has been as high as $1260 subsequently it fell steadily to $1190 for a 5.5% drop. But then gold bottomed near $1190 and as of this writing it has risen above $1220 for a 2.5% rally in a couple of days. So what does that mean for the price of gold? Is it doomed or is the bottom in and we are seeing bargain prices? This week two of our favorite commentators Casey Research and Elliott Wave International have both jumped into the discussion and I present their views here. ~ Tim McMahon, Editor Gold: Time to Prepare for Big Gains? By Casey Research Years of … [Read more...]
Inflation Falls 3rd Straight Month
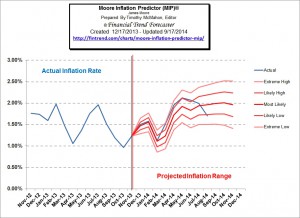
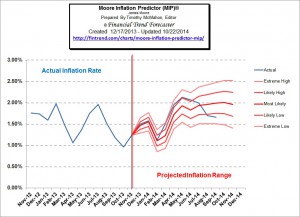
The Bureau of Labor Statistics (BLS) released the August inflation numbers today and for the third straight month inflation is lower. The annual inflation rate for the 12 months ending in May was 2.13%. The June inflation numbers were 2.07%. In July inflation fell to 1.99% and in August it was down to 1.70%. As the inflation rate falls this is "disinflation" on an annual basis although July and August were "deflationary" on a monthly basis, i.e. each monthly number was below zero at -0.04% and -0.17% respectively. Our Moore Inflation Predictor (MIP) is generally quite accurate. Last month the MIP forecast a slight decrease in inflation for August but we actually got a bit larger 14.5% … [Read more...]
Where is Gold Headed?
To get the true measure of anything it is important that you use a standardized measurement. This of course is why a "foot" or "inch" eventually became exactly a certain length and didn't vary based on each particular person doing the measuring. And more recently it is why Celsius measurement relates to the exact freezing and boiling points of water at an exact atmospheric pressure. It is also why, when we measure a commodity like Gold or the stock market we need to use a scale that doesn't change. Unfortunately, the typical measurement i.e. the U.S. dollar is always changing in value. That is the dollar depreciates due to inflation thus changing the measurement on a daily (or at least … [Read more...]
