The fallout from inflation doesn’t always receive a balanced, informed portrayal from the media. This is somewhat understandable since, unless inflation makes a drastic move, its slow steady erosion of purchasing power is not considered newsworthy. However, as with most economic forces, not everyone “loses” when inflation boosts the everyday cost of living. Inflation can actually either benefit or destroy American businesses, and individual preparation for its eventual, inevitable impact often decides how detrimental or beneficial it is. Foreign Exchange International purchases become more costly as inflation diminishes the dollar’s purchasing power relative to other currencies. This … [Read more...]
August Inflation Report
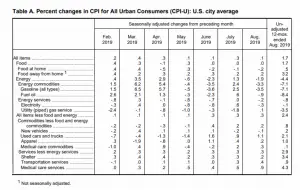
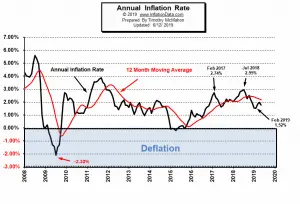
The U.S. Bureau of Labor Statistics (BLS) released their August Inflation report on September 12th 2019, for the 12 months through August 2019. Annual Inflation is Down Slightly Annual inflation in August was 1.75% very similar to the 1.79% in May and the 1.81% in July. But still above the 1.65% in June, and below the 2.00% in April. Inflation peaked at 2.95% in July 2018. CPI Index in August was 256.558. July was 256.571, June was 256.143, May was 256.092. April's was 255.548 and March was 254.202. Monthly Inflation for August was disinflationary -0.01%, July was 0.17%, June was virtually zero at 0.02%, May was 0.21%, April was 0.53%, March was 0.56%. Next release October … [Read more...]
July Inflation Report
The U.S. Bureau of Labor Statistics (BLS) released their July Inflation report on August 13th 2019, for the 12 months through July 2019. Annual Inflation is Up Annual inflation in July was 1.81% up from June's 1.65% almost identical to May's 1.79% and March's 1.86% but below April's 2.00%. CPI Index in July was 256.571, June was 256.143, May was 256.092. April's was 255.548 and March was 254.202. Monthly Inflation for July was 0.17%, June was virtually zero at 0.02%, May was 0.21%, April was 0.53%, March was 0.56%. June 2018 was 0.16%. Quantitative Tightening (QT) continued but the FED says it is stopping. Check it out here. What is Quantitative Tightening? Next release … [Read more...]
Why Does China Want to Lower the Value of Its Currency?
The U.S. Labels China a Currency Manipulator On August 5th, 2019, the U.S. Department of the Treasury designated China as a 'currency manipulator'. China has been on the U.S.'s watch list for quite some time. The U.S. believes that China "engaged in persistent one-sided intervention in the foreign exchange market". So the U.S. is requesting that the International Monetary Fund (IMF) "eliminate the unfair competitive advantage created by China's actions". Why would China want to keep the value of its currency artificially low? How Currency Exchange Rates Affect Businesses Currencies are constantly changing in value against other currencies. This is based on a variety of factors … [Read more...]
How High Inflation Drives Countries Towards Crypto
What is CryptoCurrency? A cryptocurrency (aka. Crypto), is an alternative form of payment created electronically rather than through government fiat (decree). The idea behind it is that an algorithm creates a limited amount of currency that is available to individuals to use instead of cash, checks or credit cards. The technology behind it allows you to send it directly to others without going through a 3rd party like a bank. Initially, the untraceable nature of cryptocurrency led governments to suspect that it was being used for nefarious purposes. And some notable cases of purchases on the "dark web" were prosecuted like the "Silk Road" case which operated from 2011-2013. Since then … [Read more...]
June Inflation: Down Again
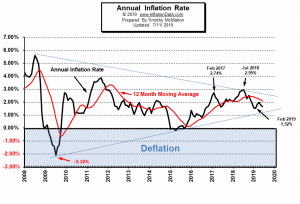
The U.S. Bureau of Labor Statistics (BLS) released their monthly Consumer Price Index report on July 11th 2019, for the 12 months through June 2019. Annual Inflation is Down Again Annual inflation in June was 1.65% down slightly from May's 1.79% which was down from 2.00% in April. The CPI-U Index was 256.143 up marginally from May's 256.092. Monthly Inflation for June was only 0.02%, May was 0.21%, April was 0.53%, March was 0.56%, June 2018 was 0.16%. Next release August 13th Annual inflation for the 12 months ending in June was 1.65% which is below the FED target of 2.00% which may account for FED Chairman Jerome Powell's signaling that the FED will be … [Read more...]
Gold Price and Its Relationship with Inflation
Inflation is the increase in the price you pay for goods and services, which affects the purchasing power of your money. This is more accurately called "price inflation" as compared to "monetary inflation". As inflation increases, the value of your money decreases. There are many different causes of inflation, but the most important cause is an increase in a country’s money supply. When the government decides to print money or implement a quantitative easing program, the money supply is increased (i.e. monetary inflation), thus affecting the general level of prices. As we can see in the following chart, the Federal Reserve engaged in three phases of quantitative easing i.e. QE1, QE2, … [Read more...]
Annual Inflation in May: Down
The U.S. Bureau of Labor Statistics (BLS) released their monthly Consumer Price Index report on June 12th 2019, for the 12 months through May 2019. Annual Inflation is Down Annual inflation in May was 1.79% down from 2.00% in April and 1.86% in March. CPI Index was 256.092 up from 255.548 in April and 254.202 in March. Monthly Inflation for May was 0.21%, April was 0.53%, March was 0.56%, May 2018 was 0.42%. Next release July 11th Quantitative Tightening (QT) continues check it out here. What is Quantitative Tightening? Annual inflation for the 12 months ending in May was 1.79% (i.e. below the FED target of 2.00%) down from 2.00% in April. But still above the 1.52% … [Read more...]
April Inflation Up Sharply
The U.S. Bureau of Labor Statistics (BLS) released their monthly Consumer Price Index report on May 10th 2019, for the 12 months through April 2019. Annual Inflation is Up Annual inflation in April was 2.00% up from 1.86% in March. CPI Index was 255.548 up from 254.202 in March. Monthly Inflation for April was 0.53%, March was 0.56%, April 2018 was 0.40%. Next release June 12th Quantitative Tightening (QT) continues check it out here. What is Quantitative Tightening? Annual inflation for the 12 months ending in April was at the FED target of 2.00% (a rare occurrence). It was Up from 1.52% in February and 1.86% in March but still below the 2.18% in November 2018. … [Read more...]
March Inflation is Up
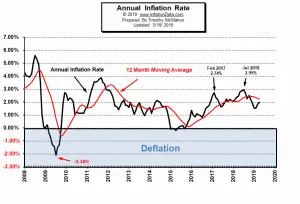
The U.S. Bureau of Labor Statistics (BLS) released their monthly Consumer Price Index report on April 10th 2019, for the 12 months through March 2019. Annual Inflation is Up Annual inflation in March was 1.86% up from 1.52% in February. CPI Index was 254.202 in March up from 252.776 in February. Monthly Inflation for March was 0.56%, in February monthly inflation was 0.42% and in March 2018 it was 0.23%. Next release May 10th We've added another bar to the Annual Inflation Rate Chart indicating Quantitative Tightening (QT) check it out here. What is Quantitative Tightening? Annual inflation peaked at 2.95% in July 2018 and fell steadily through February … [Read more...]


