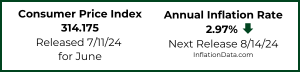
The U.S. Bureau of Labor Statistics (BLS) released their monthly Consumer Price Index report on May 10th 2019, for the 12 months through April 2019.
Annual Inflation is Up
- Annual inflation in April was 2.00% up from 1.86% in March.
- CPI Index was 255.548 up from 254.202 in March.
- Monthly Inflation for April was 0.53%, March was 0.56%, April 2018 was 0.40%.
- Next release June 12th
- Quantitative Tightening (QT) continues check it out here.
- What is Quantitative Tightening?
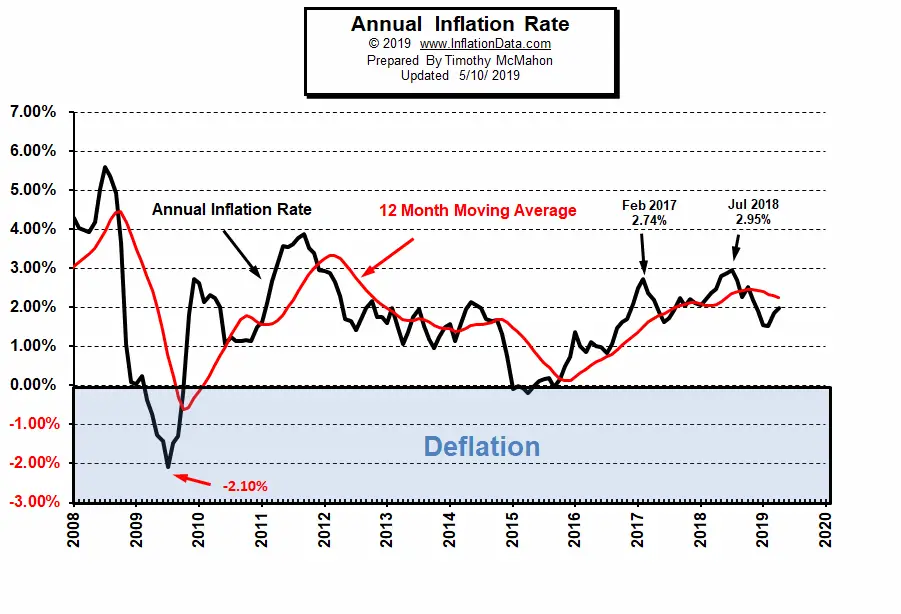
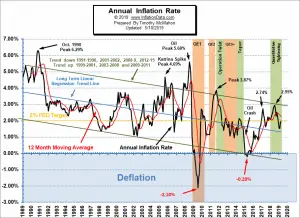 Annual inflation for the 12 months ending in April was at the FED target of 2.00% (a rare occurrence). It was Up from 1.52% in February and 1.86% in March but still below the 2.18% in November 2018. Inflation peaked at 2.95% in July 2018.
Monthly Inflation:
According to the BLS commissioner’s report “In April, the Consumer Price Index for All Urban Consumers increased 0.3 percent, seasonally adjusted; rising 2.0 percent over the year, not seasonally adjusted. The index for all items less food and energy rose 0.1 percent in April (SA); up 2.1 percent over the year (NSA). “
For several months now the inflation rate has been trending down from the top of the downward sloping channel to the midline but in the last two months it has changed direction and is moving back toward the top of the channel. Read the full commentary here.
Current Inflation Chart
If we look at the shorter term chart we can see that over the last ten years there hasn’t been a decisive trend in either direction. As a matter of fact it looks more like it has gotten less volatile and is settling down in the middle of the road at the 2.00% FED target.
Federal Reserve Actions
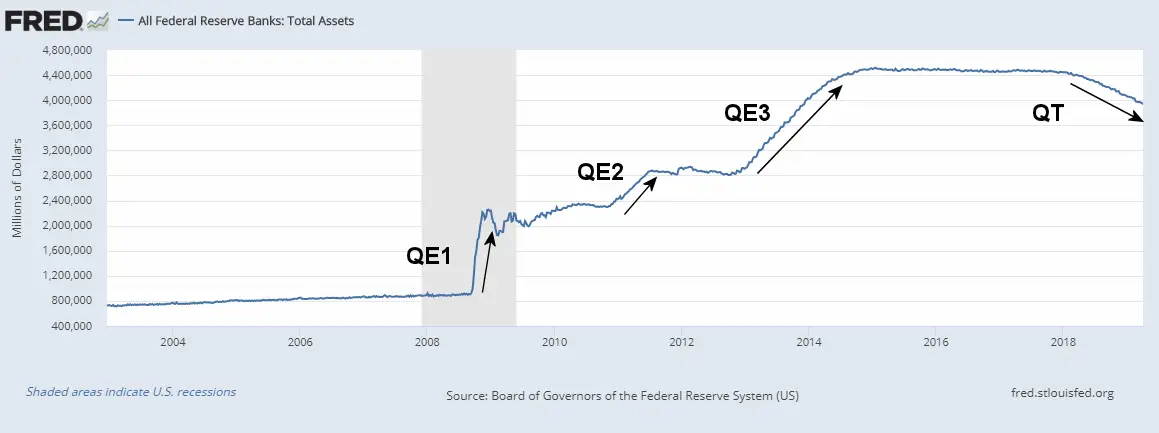
The Federal Reserve took a more active part in 2018 than it had in recent years both in raising interest rates and in Quantitative Tightening (QT). QT continued throughout April. See more information on Quantitative Tightening.
Quantitative Tightening (QT) Begins
 For more info See NYSE ROC and MIP.
Seasonally Adjusted Inflation Table

From the table above we can see that on a monthly Seasonally adjusted basis the biggest gainer was Gasoline at 5.7%. Used Cars and Trucks on the other hand fell -1.3%.
Inflation Forecast
See our Moore Inflation Predictor to see our current projections.
Not Seasonally Adjusted Monthly Inflation Rates
| Jan | Feb | Mar | Apr | May | Jun | Jul | Aug | Sep | Oct | Nov | Dec | |
| 2016 | 0.17% | 0.08% | 0.43% | 0.47% | 0.41% | 0.33% | (0.16%) | 0.09% | 0.24% | 0.12% | (0.16%) | 0.03% |
| 2017 | 0.58% | 0.31% | 0.08% | 0.30% | 0.09% | 0.09% | (0.07%) | 0.30% | 0.53% | (0.06%) | 0.00% | (0.06%) |
| 2018 | 0.54% | 0.45% | 0.23% | 0.40% | 0.42% | 0.16% | 0.01% | 0.06% | 0.12% | 0.18% | (0.33%) | (0.32%) |
| 2019 | 0.19% | 0.42% | 0.56% | 0.53% |
See: Monthly Inflation Rate for more information and a complete table of Unadjusted Monthly Rates.
Not Seasonally Adjusted Annual Inflation (by Category)
| Category | Annual |
| All Items | 2.00% |
| Food | 1.8% |
| Energy | 1.7% |
| All Items less Food and Energy | 2.1% |
| Apparel | -3.0% |
| New Vehicles | 1.2% |
| Used Cars and Trucks | 0.8% |
| Shelter | 3.4% |
| Medical Care Services | 2.3% |
| Transportation Services | 1.1% |
Note that on a monthly (seasonally adjusted) basis Energy was up 2.9% but on an annual non-adjusted basis it was up 1.7%.
Regional Inflation Information
The U.S. Bureau of Labor Statistics also produces regional data. So if you are interested in more localized inflation information you can find it here.
| AL | AK | AR | AZ | CA | CT | CO | DC | DE | FL | GA | GU | HI | IA |
| ID | IL | IN | KS | KY | LA | MA | MD | ME | MI | MN | MO | MS | MT |
| NC | ND | NE | NH | NJ | NM | NV | NY | OH | OK | OR | PA | PR | RI |
| SC | SC | SD | TX | UT | VA | VI | VT | WI | WA | WI | WV |
Food and Energy Breakdown
The BLS publishes an index entitled “All items Less Food and Energy” which often causes people some confusion. It doesn’t mean they stopped including food and energy in the Consumer Price Index. It just means that they have broken them out so you can compare their increase to other components. For more info see What is Core Inflation?
Misery Index
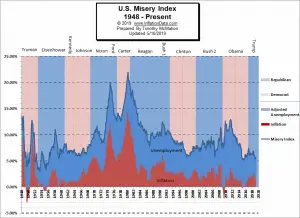 The misery index as of May 2019 (based on the most recent official government inflation and unemployment data for the 12 months ending in April) is at 5.60% down from 5.66% in March.
It had reached a low of 5.32% in February 2019. But it was 6.87% in July 2018 and 7.44% in February 2017. [Read More…]
NYSE Rate of Change (ROC)©
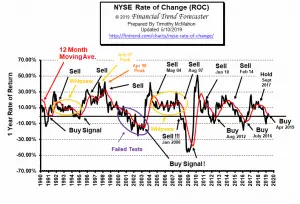 Unfortunately, after generating a buy signal last month the market has lost a bit of ground (less than 1%) but this puts the index and the moving average right on top of each other. So rather than getting a decisive cross we are getting mixed signals. This is very rare. Since 1990 it has never happened on a cross from below zero. The only similar situation happened in 2000 as the index moved from above zero to test the moving average and then began a series of failed tests ending in 2003. At this point we are not yet in that situation but if the index crosses back below the zero line it would be a big warning sign that all is not well.
See the NYSE ROC for more info.
NASDAQ Rate of Change (ROC)©
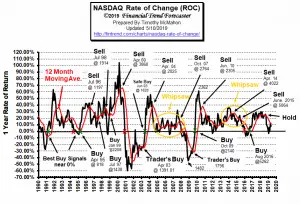
Hold Signal! NASDAQ- ROC is currently below the moving average.
The ANNUAL rate of return for the NASDAQ ROC rebounded sharply last month to test its moving average… unfortunately it failed the test and remains below the moving average.
See NASDAQ ROC for more.
You Might Also Like:
From InflationData.com
- What is Quantitative Tightening?
- What is Quantitative Easing?
- How Does Inflation Affect Foreign Exchange Rates
- Oil Price Inflation Charts and Tables Updated
- Health Insurance Inflation
- Are Deflationary Forces Taking Hold Again?
- Gold as an Investment
Read more on UnemploymentData.com.
- Art Not Paying the Bills? 4 Tech Jobs for Highly Creative Individuals
- Why You Shouldn’t Lose Sight Of Your UK Pension
- April Unemployment Lowest since 1969
- Running out of Sick Days? How to Balance Chronic Illness and Work
- Health Risks of Office Work and How to Avoid Them
From Financial Trend Forecaster
- Is Saudi Arabia Still an 800 Pound Gorilla
- Smart Money Is Piling Into Oil
- Merger Mania: The World’s Largest Oil Company And Petrochemical Company Merge
- The $32 Trillion Push To Disrupt The Entire Oil Industry
- Will EV’s Cause Peak Oil Demand?
From Elliott Wave University
- The Long-Term Message from the VIX
- Is the Falling Trade Deficit Good for Stocks?
- NASDAQ Signal Has Only Occurred 15 Times In Last 42 Years
- Is Banning “Short-Selling” a Solution?
- Traders Should Stay Optimistically Cautious
From OptioMoney.com
- Investments You’ll Thank Yourself for in Twenty Years
- 4 Strategies for Improving Your Business’s Credit Score
- Managing Your Money: 5 Personal Finances Tips for Age 30 and Up
- Savvy Ways to Save For Retirement
- Plan for the Unexpected: 4 Ways to Prepare for a Financial Emergency
From Your Family Finances
- How to Combat Rising Housing Costs as a Prospective Homeowner
- Essential Tips for Securing Your Family’s Financial Future
- 4 Areas in Your Budget to Cut Back on for Extra Spending Money
- Tips for Making Your Home Luxurious on a Budget
- Extra, Extra! 5 Skills that Could Help Your Finances


Leave a Reply