
Recent events including the pandemic were, in many ways, defined by categorical health concerns, followed by government-triggered economic uncertainty and ultimately rising inflation. This unique event in world history has triggered economic ramifications, including a potential hike in insurance rates brought about by accelerated overall inflation.
Today we’ll look at just the insurance component of overall inflation, although food and energy are more significant factors in the inflation calculation. It may be distressing to say, but insurance costs must keep up with the rate of inflation if their policies are to remain economically sustainable by the company. After all, there is nothing worse than an underfunded insurance company in a time of crisis.
Inflation Worries?
Millennials who haven’t lived through periods of high inflation don’t think inflation translates to catastrophe. Many have been taught that inflation is an intrinsic part of what drives a thriving and progressive economy. In fact, as recently as July, Vox was claiming that there was no need to worry about inflation and in March even the FED was saying, Are we expecting too much inflation?
However, it is worth noting that in the post-pandemic United States, inflation has risen to its highest rates since 1982. It would have been difficult to find anyone willing to dismiss inflation as inconsequential or essential to a thriving economy in those days.
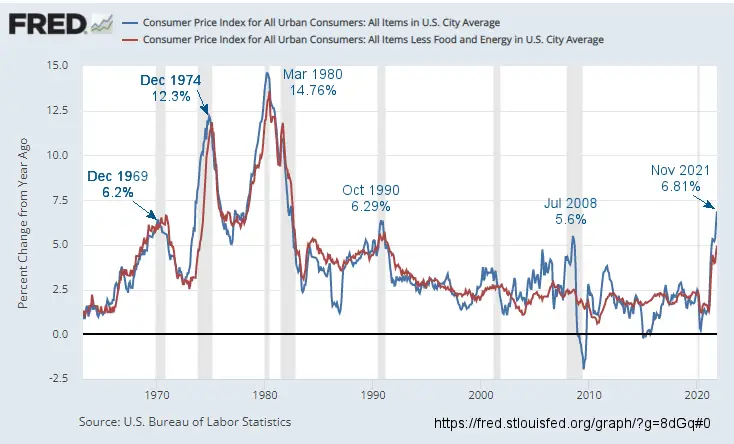
Consumer Price inflation occurs when the cost of goods and services increases, and this could cover a vast range of areas such as produce, energy, interest rates, and transport. Rising inflation may be caused by a single component, such as an energy shortage. Or inflation can be generalized over all items due to monetary factors such as a massive increase in the money supply. Whether price increases result from an increased money supply or, as recently observed, a global chip shortage, the causes, and intricacies of inflation are tricky to pin down.
In the post-pandemic economy, we have a bit of both sides of the equation. The pandemic panic severely curtailed production due to shutdowns while simultaneously pumping massive liquidity into the system via the FED’s Quantitative Easing (Q.E.) program. Thus, prices face a “double whammy” or perhaps the “perfect storm” to reawaken the sleeping inflation giant. Through much of the period since the 1980s, inflation has been relatively mild due to various factors, including low-cost competition from China… due to Nixon’s extraordinary move to open Chinese diplomatic relations after decades of isolation.
But as the cost of repairing or replacing insured items rises, so too must insurance premiums in an effort to cover the cost of the claims. While prices may not rise immediately, (generally there is a lag), insurance companies try to anticipate inflation and incorporate adjustments into premiums.
Insurance as a Percent of the CPI
According to the U.S. Bureau of Labor Statistics (BLS) that tracks the Consumer price index, “The motor vehicle insurance index covers physical damage, liability, and miscellaneous insurance coverage for private passenger vehicles. The major types of coverage included are collision, comprehensive, bodily injury liability, property damage liability, medical payments, uninsured motorist, and personal injury protection… The relative importance of an item category is its percent of the CPI weight as of December of the most recent year.” Currently, Motor Vehicle Insurance comprises 1.598% of the overall CPI-U.
Surprisingly, household insurance is only 0.366% of the CPI-U. Unfortunately, the BLS decided several years ago to switch from tracking homeowner’s costs to “Owners’ equivalent rent of residences,” so although the “Shelter” category comprises 33.316% of the CPI, that doesn’t exactly match the cost of buying a house. Here is the BLS’ reasoning:
Housing units are not in the CPI market basket. Like most other economic series, the CPI views housing units as capital (or investment) goods and not as consumption items. Spending to purchase and improve houses and other housing units is an investment and not consumption. Shelter, the service the housing units provide, is the relevant consumption item for the CPI. The cost of shelter for renter-occupied housing is rent. For an owner-occupied unit, the cost of shelter is the implicit rent that owner-occupants would have to pay if they were renting their homes. So, in other words, since you can sell your house and recoup a significant percentage of the cost (or even make a profit), therefore it isn’t a cost of living. Instead, the BLS calculates how much it would cost you to rent your house, and that is what they consider your equivalent expense. But when it comes to insurance, homeowner’s insurance costs significantly more than renter’s insurance, so the BLS may be under calculating homeowner’s insurance in the CPI.
The BLS says that health insurance comprises 1.209% of the CPI-U, but according to the Kaiser Family Foundation (KFF), the average American in 2021 paid $7,739 for single coverage and $22,221 for family coverage. According to the U.S. Census Bureau, the median household income in the U.S. in 2020 (the most recent data available) was $67,521. Simple division will tell you that $22,221/$67,521 is not 1.2%! So perhaps health insurance should be a MUCH more extensive portion of the CPI calculation. Or perhaps most Americans have health insurance as part of their employment package, but it isn’t considered part of their income? In that case, it would be regarded as a “business expense” and thus not part of the “Consumer Price Index”.
Fortunately, the BLS tracks Health Insurance as a separate index so we can compare Health Insurance inflation to CPI (all items) inflation.
Health Insurance Inflation vs. CPI-U Inflation
When we look at the percent of inflation in health insurance vs. all items, the first thing you may notice is that Health Insurance inflation is much more volatile than all items.
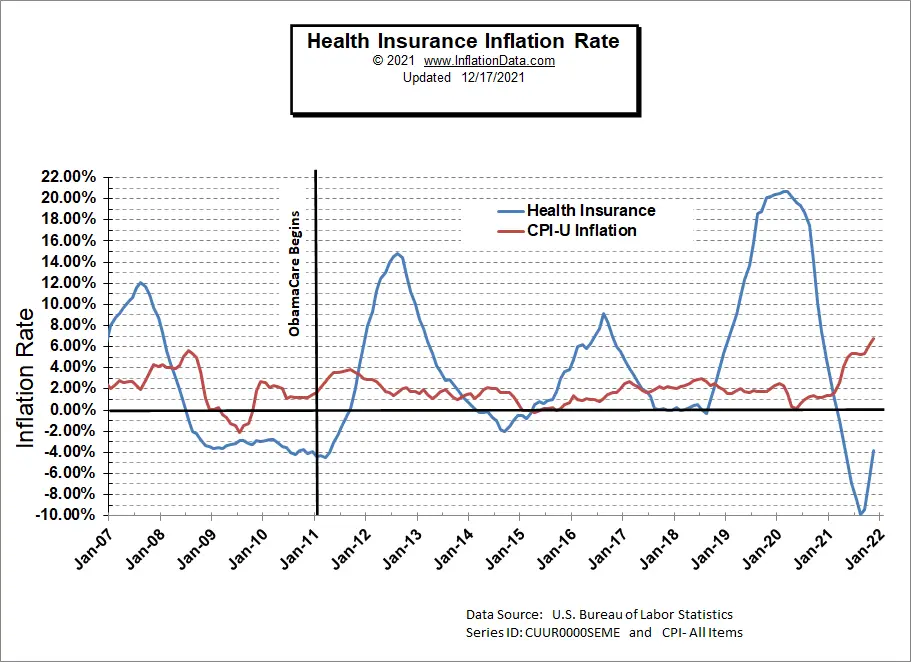 The second thing you may notice is that health insurance costs spiked considerably during 2020. This may seem logical since the insurance companies anticipated significant cost increases to cover all the expected COVID cases. Except that health insurance inflation was already at 10.73% in April of 2019 (i.e., at least 9 months BEFORE COVID hit). By August 2019, Health Insurance inflation was at 18.55%… before COVID. Then throughout early 2020, before anyone knew anything about COVID, health insurance inflation topped out around 20% and then fell during the second half of 2020. Health Insurance prices continued to fall in 2021, driving the health insurance inflation rate into negative territory (i.e., deflation).
The health insurance index Series Id: CUUR0000SEME was 142.87 in January 2019 and climbed to 172.15 by January 2020 (i.e., before COVID). It was 186.2 by August 2020, but then it started falling. By January 2021, it was 177.08 or 2.86% above January 2020. But still 23.94% above January 2019. By September 2021, the index had fallen to 166.23 before climbing again to 172.44 in November 2021. So November 2021 prices were just slightly above January 2020’s 172.15.
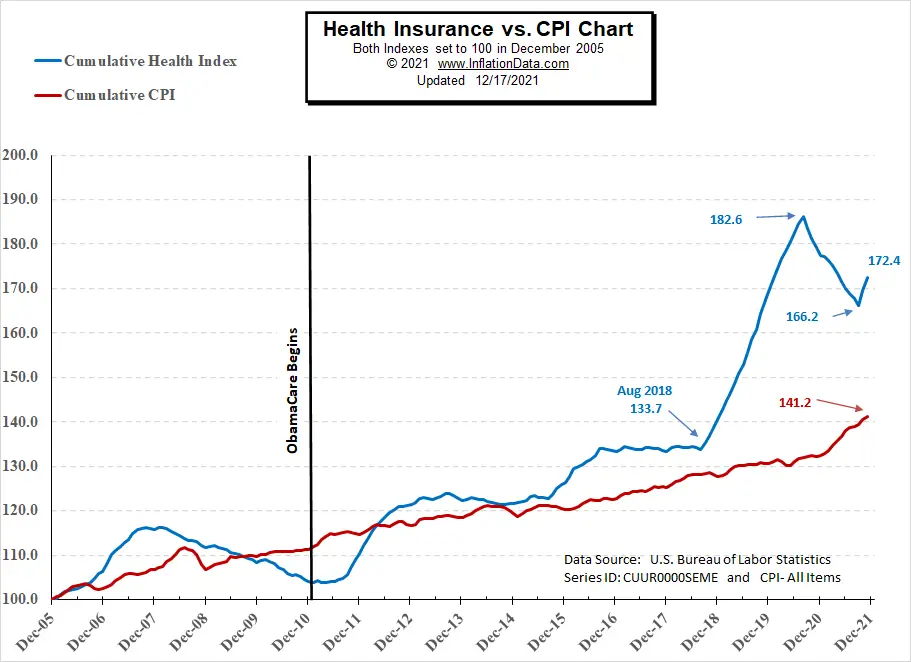 Looking at the above Health Insurance Index chart, we can see the actual increase in health insurance costs compared to overall prices. Both indexes were set to 100 in December 2005. From there, we see that initially, health insurance costs increased faster than average. Before the passage of ObamaCare, health insurance costs fell in real terms back to almost what they were in 2005. But after passing, they caught up with overall prices, and by September 2013, health insurance costs had increased almost exactly what prices in general had. But then they began increasing faster than prices in general until mid-2016, when they leveled off until August 2018, when they drastically skyrocketed, the index peaked at 182.6. Once prices reach the 200 level, they have doubled since 2005.
Higher Living Costs
Inflation directly affects your cost of living. This could include:
- The Cost of Healthcare Insurance – Rising healthcare costs may put some Americans in an adverse financial position. Inflation can exacerbate this situation.
- Auto Insurance Inflation – In most states, some form of auto insurance is mandatory. Still, if insurance rates suddenly rise or keep rising (thus reducing the value of your dollar), it may be challenging to afford a car and insurance. Inflation affects many aspects of everyday life, and sometimes, it is not as apparent as one might imagine.
- Increased Life Insurance Premiums – Many people see life insurance as a way of protecting their families after they’re gone while helping to supply them with financial security.
Note: According to the BLS– The CPI also does not include investment items, such as stocks, bonds, real estate, and life insurance because these items relate to savings and not to day-to-day consumption expenses.
Vehicle Insurance
BLS Series ID: CUUR0000SETE
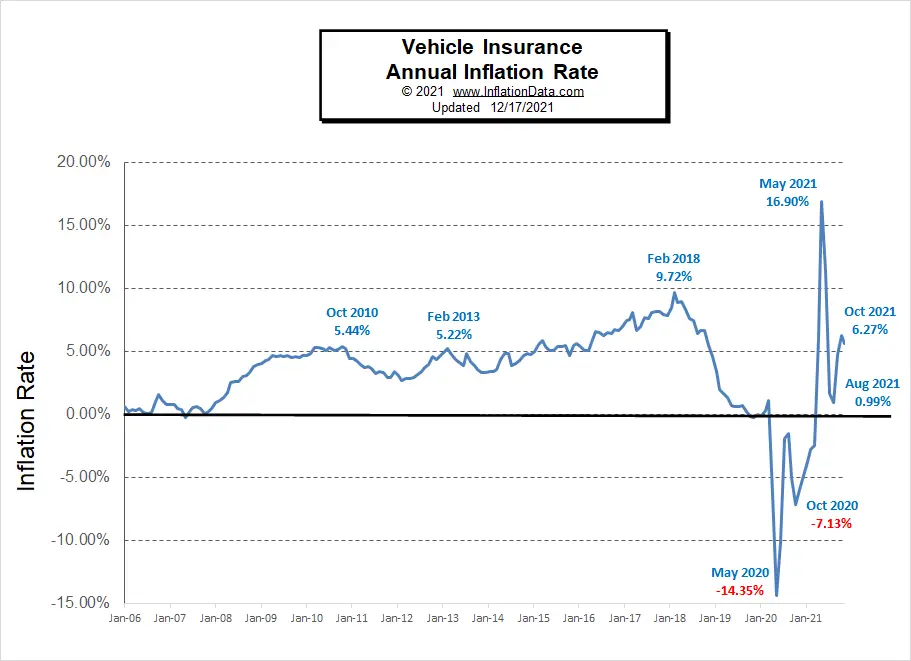
Like health insurance, motor vehicle insurance rates began climbing prior to COVID, but unlike Health insurance, they peaked in February 2018, and by the middle of 2020, they were actually falling by -14.35%.
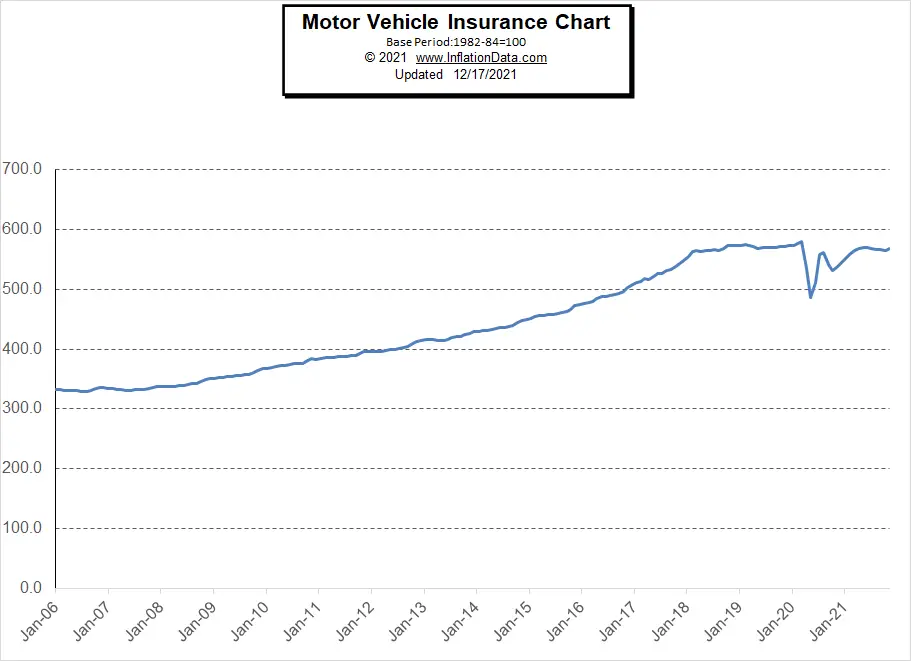 The Motor Vehicle CPI Index has a base year (100) of the average of 1982-1984, so by January of 2006, it had climbed to over 300, i.e., prices for vehicle insurance had more than tripled in just over 20 years. From there through 2008, prices were relatively stable, and then they began to gradually climb until 2018. From 2018 through 2020, prices were very stable, but then they dropped drastically during COVID and eventually returned to the pre-COVID prices in late 2021.
The Potential of Higher Payouts
Insurers and actuaries attempt to make accurate estimations based on the trajectory of the current economy while looking to history in order to predict future costs.
If inflation persists, so too does the potential for higher insurance companies’ payouts. Thus insurers attempt to adjust premiums to account for inflation and maintain a reasonable cushion against claims.
You might also like:
- Why Quantitative Easing is Inflationary… Sometimes
- Millennials Have Never Seen Inflation This High
- Is Bitcoin a Better Inflation Hedge Than Gold?
- How Nixon’s Revolutionary Move Influenced U.S. Inflation For 50 Years
- U.S. Inflation is Not the Only One Increasing
- Inflation: The New Normal?
- Health Insurance Inflation

Leave a Reply