• Home
  • Related Sites
    • Financial Trend Forecaster
      • Moore Inflation Predictor
      • NYSE Rate of Change (ROC)
      • NASDAQ Rate of Change (ROC)
      • Crypto ROC- BTC & ETH
    • Unemployment Data
      • Historical Employment Data
      • Unemployment Rate Chart
      • Labor Force Participation Rate
    • Optio Money
    • Elliott Wave University
    • More Resources
  • Definitions
    • What is Inflation?
    • What is Core Inflation?
    • Inflation vs CPI
    • What is Deflation?
    • What is Disinflation?
    • What is Agflation?
    • What is Stagflation?
    • What is Hyperinflation?
    • What is Quantitative Easing?
    • What is Quantitative Tightening?
    • What is Velocity of Money?
    • What is Fiat Currency?
    • How Do I Calculate Inflation?
    • What are “Sticky Prices” and Why Do They Matter?
  • Featured Content
  • About Us
  • Feedback
    • Sitemap
  • Subscribe Now

InflationData.com

Your Place in Cyber Space for Inflation Data

CPIWidget-Jan26
  • Numerical Inflation Data
    • Current Inflation Rate
    • Monthly Inflation Rate (Moved)
    • Historical U.S. Inflation Rates
    • Historical CPI
  • Inflation Charts
    • Ann. Inf. Rate Chart
    • Long Term Inflation >
      • Ave. Inf. by Decade
      • Total Inf. by Decade
      • Inflation 1913-1919
      • Inflation 1920-1929
      • Inflation 1930-1939
      • Inflation 1940-1949
      • Inflation 1950-1959
      • Inflation 1960-1969
      • Inflation 1970-1979
    • Cumulative Inflation
    • FED Monetary Policy and Inflation
    • Inflation and Recession
    • Confederate Inflation (1861 – 1865)
    • Misery Index
    • The 3 Stages of Inflation
    • 15-Yr Inflation Trends Chart
  • Inflation Calculators
    • Cumulative Inf. Calc.
    • How Much Would it Cost
    • Salary Inf. Calc.
    • Cost of Living Calc.
    • U.K. Inf. Calc.
    • Cost of Gas Calc.
    • Net Worth Calc.
    • Lifetime Earnings Calc.
    • Savings Goal Calc.
    • Financial Calculators
  • Inf. Adjusted Prices
    • Energy >
      • Inflation Adj. Gas Prices
      • Historical Oil Prices Chart
      • Crude Oil Price (Table)
      • Natural Gas Prices
      • Electricity Prices
      • Oil vs Gold
    • Gold >
      • Inflation Adjusted Annual Average Gold Prices
      • Gold is a “Crisis Hedge” not an  “Inflation Hedge”
      • Comparing Oil vs. Gold
    • Corn Prices
    • Education Inflation
    • Housing Prices
    • Mortgage Rates
    • NYSE Index
    • Inf. Indexed Bonds
    • Movie Revenues
    • Inflation-Adjusted Wages
  • Cost of Living
    • Calculate Cost of Living
    • Cost-of-living Adj. (COLA)
    • Consumer Price Index CPI
      • Historical CPI
      • Current CPI
      • CPI Release Dates
    • Gas Prices >
      • Cost of Gas
      • Cost of Gas Per Month
      • Gas vs. Oil Price Chart
    • Food Prices 1913 vs 2013
    • Health Insurance
  • Blog
    • Key Inflation Articles
    • International Inflation
    • Historical Inflation Rates for Japan (1971 to 2014)
You are here: Home » Blog » Housing » Do Housing Prices Always Go Up?

Do Housing Prices Always Go Up?

Published on October 27, 2021 by Tim McMahon Leave a Comment

In the last few years, housing prices have skyrocketed, and investors are once again jumping on the housing bandwagon as an excellent way to make money. The same sentiment existed in the early 2000s as housing prices were rising rapidly then as well. These periods both created the impression that “housing prices always go up”. But is that actually true?

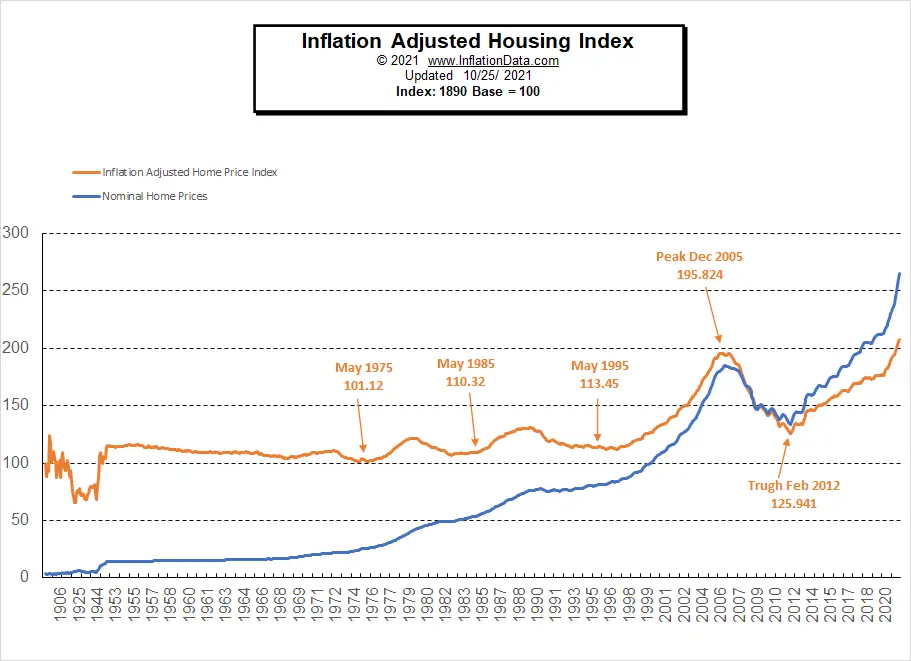
If we look at the “nominal” prices of houses, i.e., the cost in dollars BEFORE adjusting for inflation, it does appear that housing prices go up fairly consistently. In the following chart, we see housing prices since 1890. The blue line is the nominal housing price, and we can see a very gradual increase up through the early 1970s. Prices increased faster in the 1980s then leveled off during the 1990s before shooting up very drastically during the early 2000s. But then along came the crash and “the great recession,” and housing prices fell drastically.

Inflation Adjusted Housing Index since 1890Inflation-Adjusted Housing Prices

However, if we look at the inflation-adjusted prices, we get a different picture. This chart adjusts housing prices by setting the 1890 housing price to 100 and compares all other prices to that base.  Looking at the orange line on the above chart, we can see that from 1890 through 1975, housing prices were virtually flat except during the Depression Era. For much of that period, inflation-adjusted housing prices actually trended down slightly.

However, shortly after the U.S. closed the gold window in 1971, housing prices began increasing.   Over the next 20 years, inflation-adjusted prices rode an ever higher roller-coaster. But then, even inflation couldn’t keep up with housing prices. So, although housing through much of the 20th century wasn’t a great way to make money, it was an excellent inflation hedge and, for many Americans, one of the few savings programs they had.

The Rise of McMansions

With the increase of two-income households, families could afford larger houses and McMansions became popular. This resulted in an increase in the average home size which accounts for much of the increase in house prices. So, although the cost per square foot may have only increased slightly, the average house price increased because the average house got larger. But there were also economic incentives created by the government that put in place the conditions that created the housing bubble and the subsequent crash. These included loose lending practices, government subsidies, and an aftermarket for mortgages that allowed lenders to collect fees for writing mortgages, but then offload the risk of those mortgages to others.

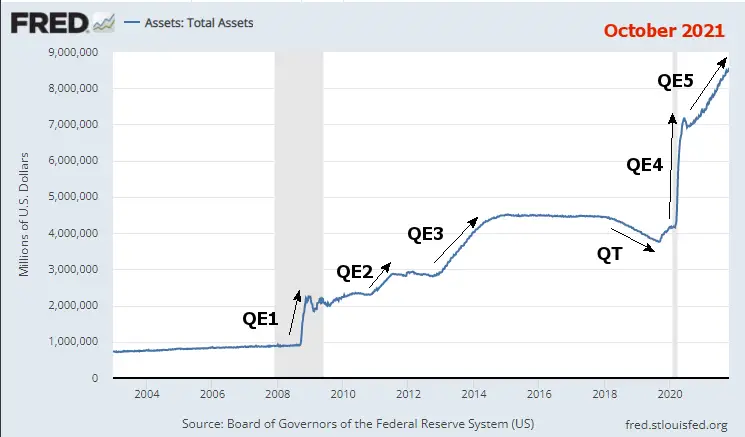
From the peak to the trough in 2012, builders were building very few new houses. So, the excess supply dried up, foreclosed houses were repaired, and people began buying homes again. And adjusted prices started rising rapidly on a sea of government-printed money.

Fed Reserve Total Assets 10-21For a more in-depth look at these factors, see our updated article: Inflation-Adjusted Housing prices

See Also:

  • How Does Inflation Affect the Price of Gold?
  • Is Gold an Inflation Hedge?
  • Which is Over Priced? Oil or Gold?
  • The Making of the Next Housing Crisis
  • Who Killed the 2007 Housing Market?
  • Cost-Effective Options for Small Family Housing
  • How to Combat Rising Housing Costs as a Prospective Homeowner
  • Housing Trends 2012- Where are the Home Buyers?
  • Ways Inflation Affects the Real Estate Market Pt1,  Pt. 2
  • Monetary Inflation vs. Price Inflation
  • How Much Has Inflation Affected Mortgage Rates in the Last 5 Years?
  • The Quantity Theory of Money
  • How “Excess Reserves” and the Money Multiplier Could Trigger Inflation

About Tim McMahon

Connect with Tim on Google+.

  • Web
  • |
  • Twitter
  • |
  • Facebook
  • |
  • LinkedIn
  • |
  • More Posts(408)

Filed Under: Housing Tagged With: housing, inflation, inflation adjusted, prices

Leave a Reply Cancel reply

Your email address will not be published. Required fields are marked *

This site uses Akismet to reduce spam. Learn how your comment data is processed.

Latest Posts

  • Updated Cumulative Inflation Calculator
  • Inflation-Adjusted Silver Prices
  • December Inflation Down Slightly, Not Flat
  • December 2025 Inflation Report for November
  • How Deflation Created the Middle Class
  • October Inflation Numbers Delayed
  • Why the 2.8% COLA May Fall Short of Real Inflation
  • Delayed BLS September Inflation Data Released

Sponsored:

As a Seasoned Investor I thought I'd seen everything... But recently I discovered TradingView which has really improved the information I have at my fingertips.~ Tim McMahon, editor

TradingView gives me an edge... including powerful charting tools, real-time market data, and a global community of traders—all in one easy to use platform. It has hundreds of indicators, and even custom scripts for more advanced users, and you don't need to change Brokers just use its seamless brokerage integration... TradingView isn't just a charting tool—it's your full trading command center.

Trade smarter. Trade faster. Check Out TradingView for free.

----------

The Best Place to Buy Your Crypto

Coinbase is the largest Crypto Trading platform in the U.S. and the easiest to use. ~Tim McMahon, editor

Check out Coinbase here

Subscribe Now

eTrends Signup Form

Elliott Wave Resources

Free Elliott Wave Resources

What is Waveopedia?

Waveopedia is EWI’s free, comprehensive index of Elliott wave patterns and terms. Everyone from beginners to experts can benefit from it. It’s a great place to send your followers if they’re new to Elliott waves.

  • Deflation Hits China is the U.S. Next?

  • Why You Must Avoid the Herding Trap

  • Chasing Trends Can Cost You

  • More Education Resources

Post Archives

Home | Articles | Sitemap | Terms of Service | Privacy | Disclaimer | Advertise With Us

Copyright © 1996-2026 · Capital Professional Services, LLC · Maintained by Design Synergy Studio · Admin

Do Not Sell My Personal Information