
Over the years we have been saying that it is important to look at prices of various commodities in terms of other commodities. For instance, we have looked at not only the Inflation Adjusted Gasoline Prices but also the Price of Oil Compared to Gold. Because of the recent volatility of Bitcoin we thought it might be interesting to look at the price of oil denominated in Bitcoin. Back in 2016, we compared Gold vs. U.S. Dollar vs. Bitcoin and recently we published Gold vs. Dollar vs. BitCoin Revisited.
Often, depending on the currency that you are accustomed to using and you earn your wages in your view of the price of a commodity can be vastly different. For instance, if your currency is depreciating rapidly (due to inflation) the price of a commodity will appear to be increasing rapidly but when looked at via a currency that is not depreciating the commodity price might be holding steady. Other factors that can affect the price of a commodity though are supply and demand. So in early 2020, when the demand for oil dropped rapidly due to the worldwide shutdown due to COVID production remained steady and storage space became an issue so the price of oil denominated in all currencies fell drastically.
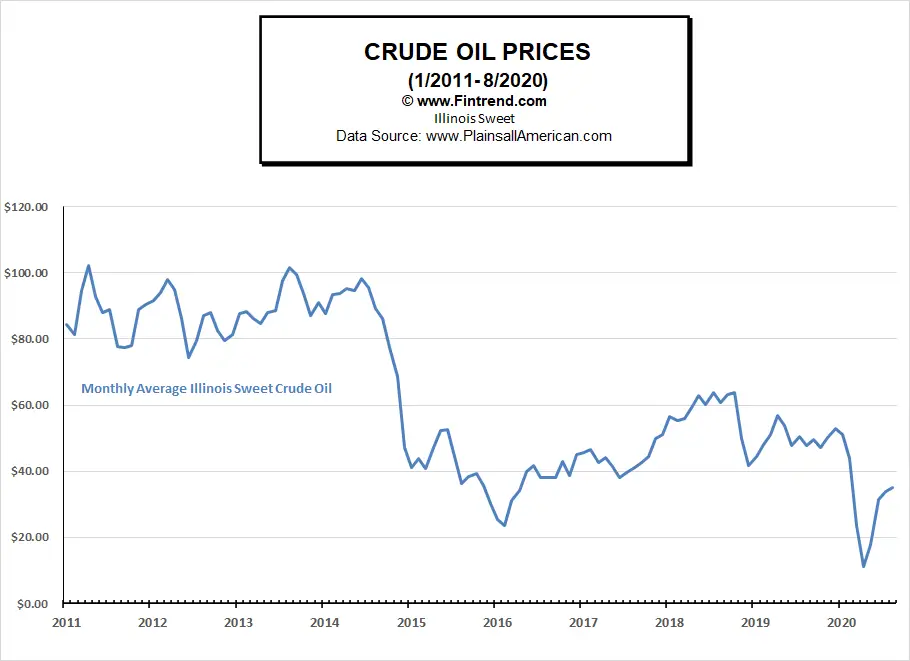
As we can see in the following chart, from 2011 through mid-2014 Oil bounced around between $80 and $100 a barrel. Since then Oil has fallen significantly actually spending a couple of days below zero in April 2020 (although the monthly average for Illinois Crude was only $11.18 since the monthly price started at around $18.00. The price for the more widely quoted West Texas Intermediate was $24.25 on April 3rd and fell to -$41.45 seventeen days later due to the expiration of the April futures contract and a lack of storage capacity for Crude Oil. See: How Can Oil Be Worth Less than Nothing? for more information.
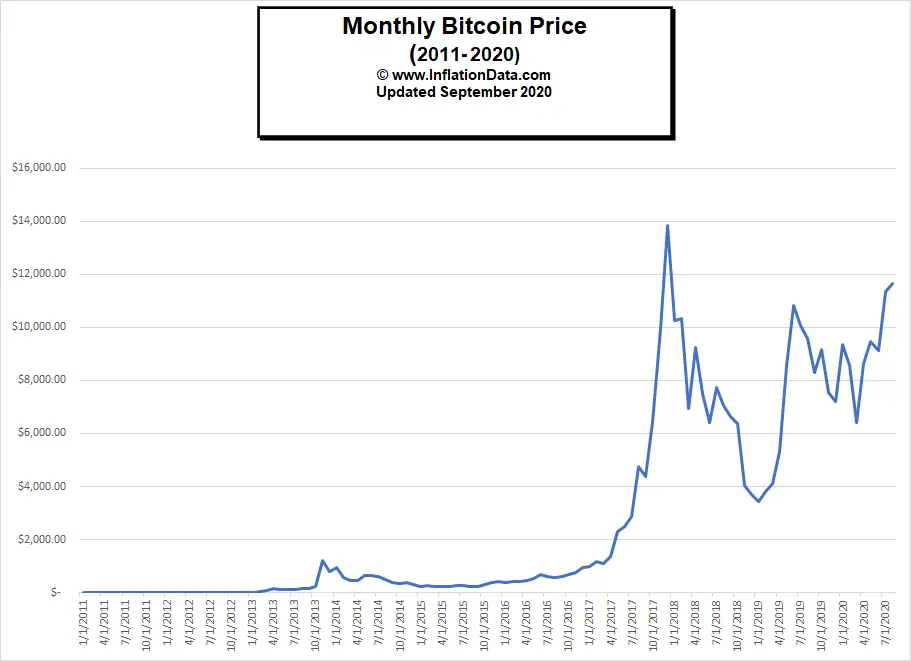
Although oil has been in a downtrend since 2014, Bitcoin, however, has been in a major uptrend during the same period. It began at less than $1.00 and is currently almost $12,000. It was not a straight climb, however. In December 2017 Bitcoin was almost $14,000 and then it was branded a fad and fell to just over $3,400 two years later. From there it has regained public confidence and has climbed to over $10,000, fallen to just over $6,000 and then climbed back to current levels.
Remember a climbing value of Bitcoin is the opposite of a currency depreciating due to inflation. So as the price rises, one Bitcoin is able to purchase more Dollars and as the price falls it purchases fewer Dollars.
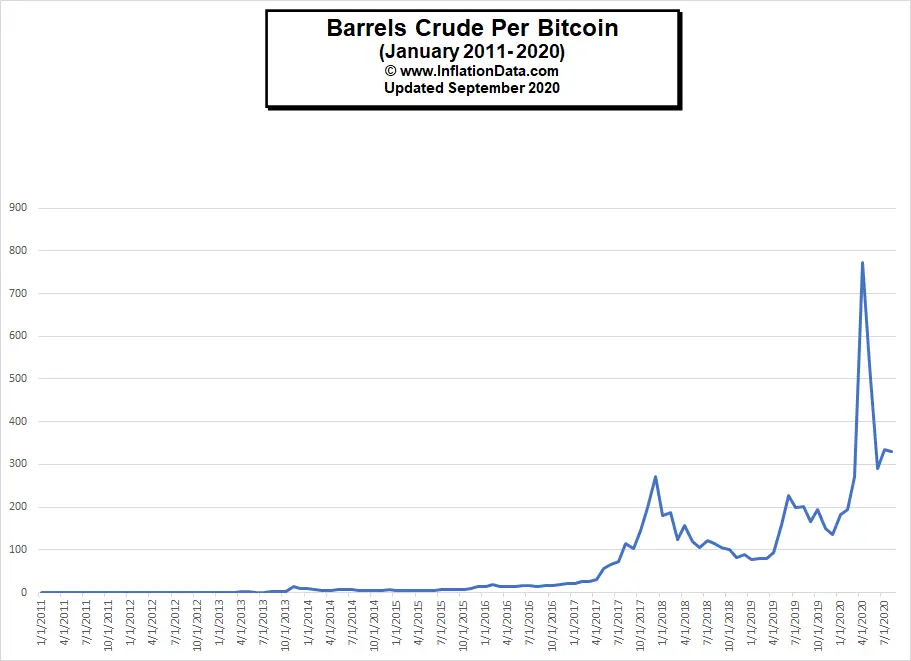
 So if Bitcoin was your currency of choice and you were purchasing barrels of crude oil it would buy more barrels of oil as well.
In the following table, we can see the price of Bitcoin compared to the price of a barrel of Crude Oil both denominated in Dollars.
| Date | $/BTC | $/ Barrel Crude Oil |
| 1/1/2011 | $ 0.50 | $ 84.47 |
| 2/1/2011 | $ 0.90 | $ 81.32 |
| 3/1/2011 | $ 0.80 | $ 94.72 |
| 4/1/2011 | $ 3.50 | $ 102.15 |
| 5/1/2011 | $ 8.70 | $ 92.92 |
| 6/1/2011 | $ 16.10 | $ 87.92 |
| 7/1/2011 | $ 13.40 | $ 88.82 |
| 8/1/2011 | $ 8.20 | $ 77.72 |
| 9/1/2011 | $ 5.10 | $ 77.31 |
| 10/1/2011 | $ 3.30 | $ 78.00 |
| 11/1/2011 | $ 3.00 | $ 88.78 |
| 12/1/2011 | $ 4.70 | $ 90.30 |
| 1/1/2012 | $ 5.50 | $ 91.71 |
| 2/1/2012 | $ 4.90 | $ 94.06 |
| 3/1/2012 | $ 4.90 | $ 98.04 |
| 4/1/2012 | $ 4.90 | $ 95.11 |
| 5/1/2012 | $ 5.20 | $ 86.20 |
| 6/1/2012 | $ 6.70 | $ 74.33 |
| 7/1/2012 | $ 9.40 | $ 79.65 |
| 8/1/2012 | $ 10.20 | $ 87.13 |
| 9/1/2012 | $ 12.40 | $ 87.89 |
| 10/1/2012 | $ 11.20 | $ 82.54 |
| 11/1/2012 | $ 12.60 | $ 79.67 |
| 12/1/2012 | $ 13.50 | $ 81.23 |
| 1/1/2013 | $ 20.40 | $ 87.65 |
| 2/1/2013 | $ 33.40 | $ 88.40 |
| 3/1/2013 | $ 93.00 | $ 86.23 |
| 4/1/2013 | $ 139.20 | $ 84.83 |
| 5/1/2013 | $ 128.80 | $ 87.93 |
| 6/1/2013 | $ 97.50 | $ 88.58 |
| 7/1/2013 | $ 106.20 | $ 97.77 |
| 8/1/2013 | $ 141.00 | $ 101.75 |
| 9/1/2013 | $ 141.90 | $ 99.40 |
| 10/1/2013 | $ 211.20 | $ 93.69 |
| 11/1/2013 | $ 1,205.70 | $ 86.96 |
| 12/1/2013 | $ 805.90 | $ 90.90 |
| 1/1/2014 | $ 938.80 | $ 87.82 |
| 2/1/2014 | $ 573.90 | $ 93.44 |
| 3/1/2014 | $ 444.70 | $ 93.66 |
| 4/1/2014 | $ 445.60 | $ 95.20 |
| 5/1/2014 | $ 627.90 | $ 94.82 |
| 6/1/2014 | $ 635.10 | $ 98.18 |
| 7/1/2014 | $ 589.50 | $ 95.46 |
| 8/1/2014 | $ 481.80 | $ 89.20 |
| 9/1/2014 | $ 388.20 | $ 86.07 |
| 10/1/2014 | $ 337.90 | $ 77.44 |
| 11/1/2014 | $ 374.90 | $ 68.62 |
| 12/1/2014 | $ 318.20 | $ 47.25 |
| 1/1/2015 | $ 218.50 | $ 40.96 |
| 2/1/2015 | $ 254.10 | $ 43.85 |
| 3/1/2015 | $ 244.10 | $ 40.74 |
| 4/1/2015 | $ 235.80 | $ 47.10 |
| 5/1/2015 | $ 229.80 | $ 52.45 |
| 6/1/2015 | $ 264.10 | $ 52.74 |
| 7/1/2015 | $ 283.70 | $ 44.43 |
| 8/1/2015 | $ 229.50 | $ 36.17 |
| 9/1/2015 | $ 235.90 | $ 38.41 |
| 10/1/2015 | $ 311.20 | $ 39.40 |
| 11/1/2015 | $ 378.00 | $ 35.73 |
| 12/1/2015 | $ 430.00 | $ 30.27 |
| 1/1/2016 | $ 369.80 | $ 25.27 |
| 2/1/2016 | $ 436.20 | $ 23.58 |
| 3/1/2016 | $ 415.70 | $ 31.08 |
| 4/1/2016 | $ 448.50 | $ 34.01 |
| 5/1/2016 | $ 528.90 | $ 39.88 |
| 6/1/2016 | $ 670.00 | $ 41.69 |
| 7/1/2016 | $ 621.90 | $ 38.05 |
| 8/1/2016 | $ 573.90 | $ 37.99 |
| 9/1/2016 | $ 608.10 | $ 37.98 |
| 10/1/2016 | $ 698.70 | $ 42.81 |
| 11/1/2016 | $ 742.50 | $ 38.56 |
| 12/1/2016 | $ 963.40 | $ 45.19 |
| 1/1/2017 | $ 965.50 | $ 45.75 |
| 2/1/2017 | $ 1,189.30 | $ 46.53 |
| 3/1/2017 | $ 1,079.10 | $ 42.65 |
| 4/1/2017 | $ 1,351.90 | $ 44.12 |
| 5/1/2017 | $ 2,303.30 | $ 41.56 |
| 6/1/2017 | $ 2,480.60 | $ 38.21 |
| 7/1/2017 | $ 2,883.30 | $ 39.60 |
| 8/1/2017 | $ 4,735.10 | $ 41.20 |
| 9/1/2017 | $ 4,360.60 | $ 42.56 |
| 10/1/2017 | $ 6,451.20 | $ 44.56 |
| 11/1/2017 | $ 9,946.80 | $ 49.77 |
| 12/1/2017 | $ 13,850.40 | $ 51.07 |
| 1/1/2018 | $ 10,265.40 | $ 56.60 |
| 2/1/2018 | $ 10,333.90 | $ 55.22 |
| 3/1/2018 | $ 6,938.20 | $ 55.93 |
| 4/1/2018 | $ 9,245.10 | $ 59.30 |
| 5/1/2018 | $ 7,502.60 | $ 62.87 |
| 6/1/2018 | $ 6,398.90 | $ 60.25 |
| 7/1/2018 | $ 7,729.40 | $ 63.90 |
| 8/1/2018 | $ 7,033.80 | $ 60.78 |
| 9/1/2018 | $ 6,635.20 | $ 63.07 |
| 10/1/2018 | $ 6,365.90 | $ 63.69 |
| 11/1/2018 | $ 4,039.70 | $ 49.83 |
| 12/1/2018 | $ 3,709.40 | $ 41.81 |
| 1/1/2019 | $ 3,437.20 | $ 44.56 |
| 2/1/2019 | $ 3,816.60 | $ 48.05 |
| 3/1/2019 | $ 4,102.30 | $ 51.06 |
| 4/1/2019 | $ 5,320.80 | $ 56.76 |
| 5/1/2019 | $ 8,558.30 | $ 53.87 |
| 6/1/2019 | $ 10,818.60 | $ 47.85 |
| 7/1/2019 | $ 10,082.00 | $ 50.46 |
| 8/1/2019 | $ 9,594.40 | $ 47.85 |
| 9/1/2019 | $ 8,284.30 | $ 49.66 |
| 10/1/2019 | $ 9,152.60 | $ 47.11 |
| 11/1/2019 | $ 7,546.60 | $ 50.07 |
| 12/1/2019 | $ 7,196.40 | $ 52.82 |
| 1/1/2020 | $ 9,349.10 | $ 50.96 |
| 2/1/2020 | $ 8,543.70 | $ 43.73 |
| 3/1/2020 | $ 6,412.50 | $ 23.57 |
| 4/1/2020 | $ 8,629.00 | $ 11.18 |
| 5/1/2020 | $ 9,454.80 | $ 17.80 |
| 6/1/2020 | $ 9,135.40 | $ 31.35 |
| 7/1/2020 | $ 11,333.40 | $ 33.74 |
| 8/1/2020 | $ 11,644.20 | $ 35.17 |
Looking at the middle column (# of Bitcoins to buy 1 barrel of oil) of the following chart we can see that with Bitcoin valued at at 50¢ on January 1, 2011 it would take 168.94 Bitcoins to buy one barrel of oil, but only a month later it would only take a little over 90 bitcoins to purchase a barrel of oil. And by June 2011, it would take about 5 ½ bitcoins to buy a barrel of oil. As the value of a Bitcoin was much more volatile than the price of oil we see that the cost of a barrel of oil bounced up to just over 29 ½ bitcoins in November 2011 before dropping to 2/3rds of a bitcoin in April 2013. From there we see that the price of oil fell to minuscule fractions of a single Bitcoin.
Looking at the third column (barrels of Crude Oil per 1 Bitcoin) of the following table we can see that initially, a single bitcoin would buy a small fraction of a barrel of Crude oil. By August 2011 a Bitcoin would buy 1/10th of a barrel of oil. March of 2013 was the first time a single bitcoin would buy more than a barrel of oil. Just a few months later a single Bitcoin would buy over 13 barrels of oil but that didn’t last long. By April 2014, a Bitcoin would only buy less than 5 barrels of oil. But with the rebound in the value of Bitcoins by December 2016 a single bitcoin would buy over 21 barrels of oil. And by August of 2020, a Bitcoin would buy over 331 barrels of oil.
| Date | BTC/Barrel | Barrel/BTC |
| 1/1/2011 | 168.94 | 0.0059193 |
| 2/1/2011 | 90.355556 | 0.0110674 |
| 3/1/2011 | 118.4 | 0.0084459 |
| 4/1/2011 | 29.185714 | 0.0342633 |
| 5/1/2011 | 10.68046 | 0.0936289 |
| 6/1/2011 | 5.4608696 | 0.183121 |
| 7/1/2011 | 6.6283582 | 0.1508669 |
| 8/1/2011 | 9.4780488 | 0.1055069 |
| 9/1/2011 | 15.158824 | 0.0659682 |
| 10/1/2011 | 23.636364 | 0.0423077 |
| 11/1/2011 | 29.591667 | 0.0337933 |
| 12/1/2011 | 19.212766 | 0.0520487 |
| 1/1/2012 | 16.674545 | 0.0599716 |
| 2/1/2012 | 19.195918 | 0.0520944 |
| 3/1/2012 | 20.008163 | 0.0499796 |
| 4/1/2012 | 19.410204 | 0.0515193 |
| 5/1/2012 | 16.576923 | 0.0603248 |
| 6/1/2012 | 11.09403 | 0.0901386 |
| 7/1/2012 | 8.4734043 | 0.1180163 |
| 8/1/2012 | 8.5421569 | 0.1170665 |
| 9/1/2012 | 7.0879032 | 0.1410854 |
| 10/1/2012 | 7.3696429 | 0.1356918 |
| 11/1/2012 | 6.3230159 | 0.1581524 |
| 12/1/2012 | 6.0167259 | 0.1662033 |
| 1/1/2013 | 4.2967255 | 0.2327354 |
| 2/1/2013 | 2.6467605 | 0.3778204 |
| 3/1/2013 | 0.9271591 | 1.0785635 |
| 4/1/2013 | 0.6094346 | 1.6408651 |
| 5/1/2013 | 0.6826661 | 1.4648449 |
| 6/1/2013 | 0.9085467 | 1.1006589 |
| 7/1/2013 | 0.9205847 | 1.0862661 |
| 8/1/2013 | 0.7216312 | 1.3857494 |
| 9/1/2013 | 0.7004933 | 1.4275654 |
| 10/1/2013 | 0.4435866 | 2.254351 |
| 11/1/2013 | 0.0721227 | 13.865266 |
| 12/1/2013 | 0.1127932 | 8.8657866 |
| 1/1/2014 | 0.0935477 | 10.689731 |
| 2/1/2014 | 0.1628115 | 6.1420736 |
| 3/1/2014 | 0.2106168 | 4.7479589 |
| 4/1/2014 | 0.2136445 | 4.6806723 |
| 5/1/2014 | 0.1510113 | 6.6220207 |
| 6/1/2014 | 0.154582 | 6.4690604 |
| 7/1/2014 | 0.1619333 | 6.1753808 |
| 8/1/2014 | 0.1851424 | 5.4012484 |
| 9/1/2014 | 0.2217071 | 4.5104553 |
| 10/1/2014 | 0.2291906 | 4.3631809 |
| 11/1/2014 | 0.1830267 | 5.4636845 |
| 12/1/2014 | 0.1484915 | 6.7343915 |
| 1/1/2015 | 0.1874586 | 5.3345117 |
| 2/1/2015 | 0.1725628 | 5.7949927 |
| 3/1/2015 | 0.1669066 | 5.991375 |
| 4/1/2015 | 0.1997455 | 5.0063694 |
| 5/1/2015 | 0.2282419 | 4.3813155 |
| 6/1/2015 | 0.1997028 | 5.007442 |
| 7/1/2015 | 0.1565999 | 6.3856989 |
| 8/1/2015 | 0.1576009 | 6.3451426 |
| 9/1/2015 | 0.162816 | 6.1419016 |
| 10/1/2015 | 0.1265913 | 7.8994395 |
| 11/1/2015 | 0.0945106 | 10.580826 |
| 12/1/2015 | 0.0704051 | 14.203513 |
| 1/1/2016 | 0.0683237 | 14.636212 |
| 2/1/2016 | 0.0540523 | 18.500611 |
| 3/1/2016 | 0.0747669 | 13.374903 |
| 4/1/2016 | 0.0758268 | 13.187957 |
| 5/1/2016 | 0.0753999 | 13.262619 |
| 6/1/2016 | 0.0622264 | 16.070345 |
| 7/1/2016 | 0.0611809 | 16.344971 |
| 8/1/2016 | 0.0661995 | 15.105852 |
| 9/1/2016 | 0.0624486 | 16.013167 |
| 10/1/2016 | 0.0612709 | 16.320953 |
| 11/1/2016 | 0.0519327 | 19.255705 |
| 12/1/2016 | 0.0469068 | 21.318876 |
| 1/1/2017 | 0.0473848 | 21.103825 |
| 2/1/2017 | 0.0391239 | 25.559854 |
| 3/1/2017 | 0.0395237 | 25.30129 |
| 4/1/2017 | 0.0326355 | 30.641432 |
| 5/1/2017 | 0.0180437 | 55.421078 |
| 6/1/2017 | 0.0154035 | 64.920178 |
| 7/1/2017 | 0.0137343 | 72.810606 |
| 8/1/2017 | 0.008701 | 114.92961 |
| 9/1/2017 | 0.0097601 | 102.45771 |
| 10/1/2017 | 0.0069072 | 144.77558 |
| 11/1/2017 | 0.0050036 | 199.85533 |
| 12/1/2017 | 0.0036873 | 271.20423 |
| 1/1/2018 | 0.0055134 | 181.37775 |
| 2/1/2018 | 0.0053439 | 187.12968 |
| 3/1/2018 | 0.0080608 | 124.05726 |
| 4/1/2018 | 0.0064142 | 155.90388 |
| 5/1/2018 | 0.0083799 | 119.33324 |
| 6/1/2018 | 0.0094157 | 106.20581 |
| 7/1/2018 | 0.0082665 | 120.96996 |
| 8/1/2018 | 0.0086415 | 115.72119 |
| 9/1/2018 | 0.0095049 | 105.20925 |
| 10/1/2018 | 0.0100054 | 99.945834 |
| 11/1/2018 | 0.0123359 | 81.064268 |
| 12/1/2018 | 0.0112704 | 88.727829 |
| 1/1/2019 | 0.012964 | 77.136445 |
| 2/1/2019 | 0.0125897 | 79.429761 |
| 3/1/2019 | 0.0124467 | 80.342734 |
| 4/1/2019 | 0.0106676 | 93.742072 |
| 5/1/2019 | 0.0062945 | 158.8695 |
| 6/1/2019 | 0.0044229 | 226.09404 |
| 7/1/2019 | 0.005005 | 199.80182 |
| 8/1/2019 | 0.0049873 | 200.50993 |
| 9/1/2019 | 0.0059945 | 166.82038 |
| 10/1/2019 | 0.0051472 | 194.28147 |
| 11/1/2019 | 0.0066348 | 150.72099 |
| 12/1/2019 | 0.0073398 | 136.24385 |
| 1/1/2020 | 0.0054508 | 183.46066 |
| 2/1/2020 | 0.0051187 | 195.36138 |
| 3/1/2020 | 0.003676 | 272.03194 |
| 4/1/2020 | 0.001296 | 771.59693 |
| 5/1/2020 | 0.0018826 | 531.16854 |
| 6/1/2020 | 0.0034317 | 291.40032 |
| 7/1/2020 | 0.0029772 | 335.88506 |
| 8/1/2020 | 0.0030203 | 331.08896 |
But at it’s peak in April 2020, when Oil was so cheap a single Bitcoin would actually buy over 770 barrels of oil (if you had a place to store it).
You might also like:
- How has Venezuela’s Bitcoin experiment Fared?
- Inflation Adjusted Gasoline Prices
- Price of Oil Compared to Gold.
- Gold vs. U.S. Dollar vs. Bitcoin
- Gold vs. Dollar vs. BitCoin Revisited.

Leave a Reply