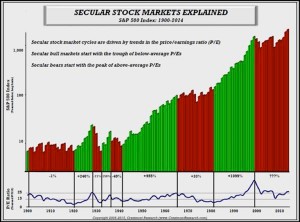
In today's article John Mauldin looks at the "Big D" deflation plus the difference between the out look and time-frame of the average investor and that of the professional money manager. He also looks at the difference between "secular" and "cyclical" bull and bear stock markets. We also have an article by Jawad Mian entitled "A Little Less Deflation, A Little More Reflation, Please". Enjoy! ~ Tim McMahon, editor Thoughts from the Frontline: World War D—Deflation By John Mauldin Everywhere I go I’m asked, “Will there be inflation or deflation? Are we in a bull or bear market? Is the bond bull market over and will interest rates rise?”The flippant answer to all those questions is “Yes.” … [Read more...]
April Ends Another Deflationary Year
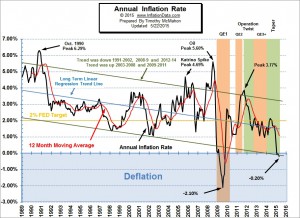
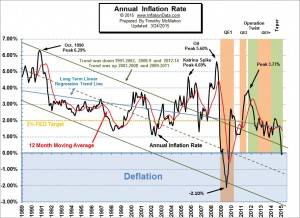
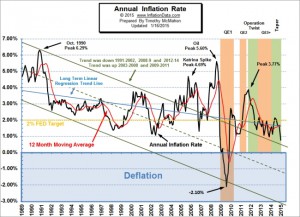
The Bureau of Labor Statistics (BLS) released their monthly Consumer Price Index (CPI-U) and Inflation report on May 22nd for the year ending in April. This resulted in the 4th month in a row where the numbers were negative (i.e. deflationary). Although the month of April itself saw prices increase 0.20% the net effect for the whole year was still -0.20%. We have seen a steady decline in inflation since May 2014 when it was 2.13%. The progression included June at 2.07% then July at 1.99%, August was 1.70%, then September and October were both 1.66%, November was 1.32%, December was 0.76% and then January was a deflationary -0.09%, February was -0.03%, March was -0.07% and finally April … [Read more...]
“Glinda the Good” Deflation Isn’t Looking So… Good
Cold weather, falling wages, bizarre fluke? The real reason consumers aren't spending is... defensive, deflationary psychology By Elliott Wave International Editor's note: You'll find the text version of the story below the video. Learn What You Need to Know NOW About Deflation Get Your Free Report Now » When 2015 began, the mainstream financial experts were certain of one thing: Even if the United States economy were sliding into deflation (which, they said, was open to discussion) that particular kind of Glinda the Good deflation, characterized by plunging energy and food prices, was going to be a boon for consumer spending: "Good deflation a tax cut for … [Read more...]
Deflation Again
The Bureau of Labor Statistics (BLS) released the inflation statistics for the month of March on April 17th. Once again we have slight deflation on an Annual basis. The Consumer Price index (CPI-U) at the end of March 2015 was 236.119 while it was 236.293 at the end of March 2014. So overall prices are just a hair lower a full year later. That means there was -0.07% inflation and as we all know negative inflation on an annual basis is called Deflation. Because the BLS rounds all their results to one decimal place they have rounded it to -0.1% , which is what they said it was in January as well. Rounded to two places it is -0.09% for January, -0.03% for February and -0.07% for March which … [Read more...]
Living in a Free-Lunch World
It seems that every once in a while, we awake from a deep sleep with what appears to us to be a brilliant revelation. Unfortunately, if we don't write them down they are usually forgotten by morning. Sometimes in the light of day they turn out to be totally ridiculous... but occasionally they actually do turn out to be a flash of inspiration. I had one such experience a few weeks ago. Of late I have been increasingly disturbed by the growing gulf between Liberals and Conservatives. It seems that they can't find any common ground and for all intents and purposes might be living on entirely different worlds. My revelation, although perhaps not earth-shattering, was to me at least … [Read more...]
Deflation Watch: Key Economic Measures Turn South
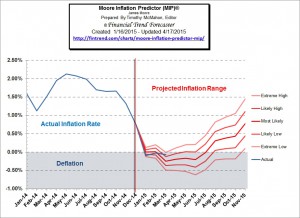
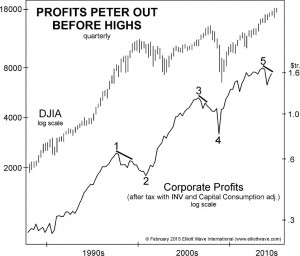
Last month (12 months ending January 2015) inflation dipped below zero resulting in an annual deflation of -0.09% rounded to -0.1% by the Bureau of Labor Statistics (BLS). The 12 months ending in February bounced up slightly to -0.03 but the BLS was able to round that up to Zero thus giving the impression that the deflation was over. But our Moore Inflation Predictor is saying otherwise. It indicates that we could be in for as much as 6 more months of deflation. And now the analysts at Elliott Wave International have found that several key economic indicators are also turning Bearish and confirming our deflation prediction. These key indicators include: Corporate profits, Retail and Food … [Read more...]
Deflation Almost Zero
The Bureau of Labor Statistics (BLS) released the inflation statistics for the month of February on March 24th. According to the official numbers there was neither inflation nor deflation for the 12 months ending in February. Technically that wasn't exactly correct. The Consumer Price index (CPI-U) in February 2014 was 234.781 and in February 2015 it was 234.722. So actually there was -0.03% inflation and as we all know negative inflation on an annual basis is called "the big D" or Deflation. However, since the BLS rounds all their results to one decimal place they have rounded it to zero, that is prices are essentially the same as one year ago. Now before you send me nasty-grams saying … [Read more...]
Deflation Days are Here Again
The U.S. Bureau of Labor Statistics (BLS) released the Consumer Price Index (CPI-U) data today for the month of January. The verdict was that inflation had fallen rapidly from 0.76% in December to a slightly deflationary -0.09% for the 12 months ending in January. This is the first time since 2009 that we have seen Annual deflation although there were several times during 2014 that we saw monthly deflation. Monthly deflation (annual disinflation) means that prices are slightly lower than they were last month but still higher than a year ago, which typically happens a few times every year (generally in the 4th quarter), but this year prices began falling during the summer, indicating … [Read more...]
Annual Inflation Below 1%
The U.S. Bureau of Labor Statistics released their monthly Consumer Price Index (CPI) data on Friday January 16th for December and for the first time since 2009 reported annual inflation below 1% (although we calculated October 2013 at 0.96%). The Consumer Price Index (CPI) for December was 234.812 down from November’s 236.151 which was also down from 237.433 for October. This resulted in a monthly decrease in prices of -0.57% and an annual inflation rate of 0.76%. Overall energy on a “seasonally adjusted” basis was down -4.7% for the month and -10.6% on an unadjusted basis for the entire year. Fuel oil fell -7.8% for the month (adjusted) and a whopping -19.1% annually. Gasoline was … [Read more...]
Bureau of Labor Statistics: Inflation Down
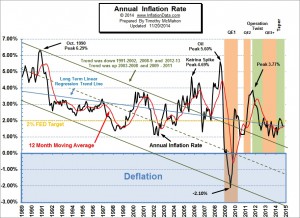
The U.S. Bureau of Labor Statistics released their monthly Consumer Price Index (CPI) data on Wednesday December 17th for November and reported lower inflation. The CPI for November was 236.151 down from 237.433 for October. This resulted in a monthly decrease in prices of -0.54% and an annual inflation rate of 1.32% down from 1.66% in October. View the chart and read the full commentary on the current annual inflation rate. Although the FED has been targeting a 2% annual inflation rate, rates are currently much lower and have often been considerably higher than 2% as well. The FED has hit their 2% target a total of 6 times out of more than 300 data points. If we count all the … [Read more...]

